Table of Contents
- SUV statistics: the market is no longer shifting toward SUVs—it has already tipped.
- Table of contents
- U.S. SUV market share statistics show complete category dominance
- SUV ownership statistics: more than 114 million are already on U.S. roads
- SUV segment statistics reveal where growth is concentrating
- Top SUV brands and best-selling SUV models in the U.S.
- SUV pricing, weight, and fuel economy benchmarks
- Electric SUV statistics show the segment shaping EV adoption too
- Global SUV statistics: more than half of car sales worldwide now come from SUVs
- Global SUV market size and growth forecasts
- Global best-selling SUV statistics
- SUV safety statistics and pedestrian risk data
SUV statistics: the market is no longer shifting toward SUVs—it has already tipped.
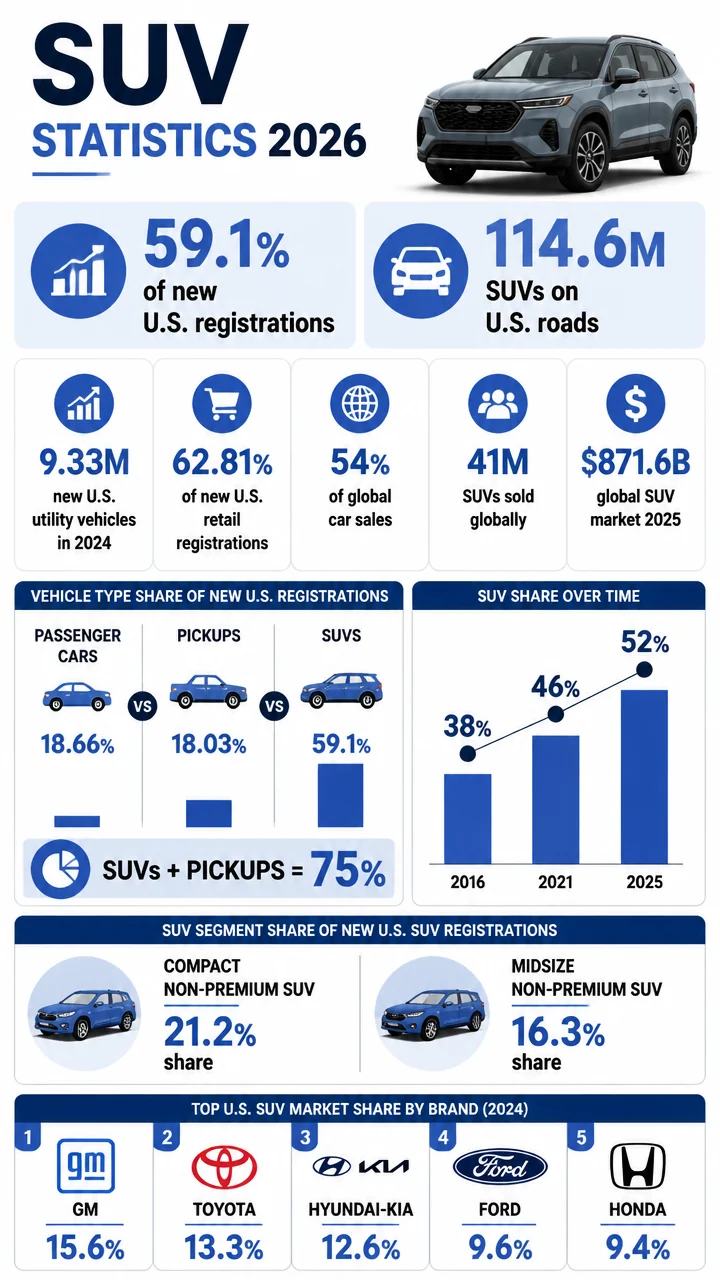
In the U.S., utility vehicles captured 59.10% of new registrations in 2024, while more than 114.58 million SUVs were on the road by March 2025.
Globally, SUVs accounted for 54% of total car sales in 2024, underscoring just how thoroughly the segment now defines the auto market.
- 59.10% of new U.S. vehicle registrations in 2024 were utility vehicles.
- 9,328,637 new utility vehicles were registered in the U.S. in 2024.
- 113,384,621 utility vehicles were registered on U.S. roads at the end of 2024.
- 114.58 million+ SUVs were in operation in the U.S. in March 2025.
- 62.81% of new U.S. retail registrations in the 12 months ending March 2025 were SUVs.
- 54% of global car sales in 2024 were SUVs.
- 41 million SUV units were sold globally in 2024.
- $871.59 billion was the estimated global SUV market value in 2025.
Table of contents
- U.S.
SUV market share statistics
- SUV ownership and vehicles in operation
- SUV segment mix and category growth
- Top SUV brands and best-selling models
- SUV pricing, weight, and fuel economy benchmarks
- Electric SUV statistics
- Global SUV statistics and market size
- SUV safety and pedestrian risk statistics
SUVs accounted for 59.10% of new U.S. vehicle registrations in 2024, according to Alliance for Automotive Innovation data.
That translated to 9,328,637 newly registered utility vehicles out of 15.79 million total light-vehicle registrations.
That share is striking on its own, but it becomes even more revealing when compared with the rest of the market.
Passenger cars fell to just 18.66% of new U.S. registrations in 2024, while pickup trucks represented 18.03%.
SUVs alone now outsell cars and pickups individually by a wide margin in the U.S. In 2024, their registration share was more than three times that of passenger cars.
JATO Dynamics data reinforces the same pattern from another angle: U.S.
SUVs and pickup trucks combined accounted for 75% of 2024 new-vehicle registrations, showing how overwhelmingly the market now favors larger body styles.
Volume also kept growing.
Total U.S.
SUV sales reached 9.17 million units in 2024, up 5% year over year.
| U.S. new-vehicle mix | 2024 share |
|---|---|
| Utility vehicles (SUVs) | 59.10% |
| Passenger cars | 18.66% |
| Pickup trucks | 18.03% |
The longer-term trend is just as clear.
GCBC reported that SUVs accounted for 52% of new U.S. vehicle sales in 2025, up from 46% in 2021 and 38% in 2016.
That means SUV share rose by 14 percentage points in less than a decade.
From 38% in 2016 to 52% in 2025: SUVs have gone from a leading segment to the defining shape of the American new-car market.
Meanwhile, traditional cars kept shrinking.
Cars of all sizes represented just 15.4% of the 2025 market, down 1.4 percentage points as SUVs gained share.
SUV ownership statistics: more than 114 million are already on U.S. roads
113,384,621 utility vehicles were registered on U.S. roads as of December 31, 2024.
That means utility vehicles represented 39.20% of all vehicles in operation.
Just a few months later, Experian reported that more than 114.58 million SUVs were on U.S. roads in March 2025, equal to 41.96% of all vehicles in operation.
114.58 million SUVs on the road means the category is no longer simply popular in new sales—it is now a dominant part of the U.S. vehicle fleet.
Retail data shows the same consumer preference.
In the 12 months ending March 2025, SUVs captured 62.81% of new U.S. retail registrations.
Ownership preferences also appear sticky rather than temporary:
- 41% of U.S. car owners say SUVs and crossovers are their primary vehicle.
- Sedans trail at 30%.
- 66% of current U.S.
SUV owners planning to buy within the next year intend to purchase another SUV.
That replacement behavior matters because it suggests SUV dominance is self-reinforcing.
Once households move into the category, most appear likely to stay there.
SUV segment statistics reveal where growth is concentrating
Not all SUVs are growing equally.
The strongest momentum is concentrated in mainstream, non-premium segments.
Compact Non-Premium SUVs held a 21.2% U.S. market share in 2025, an all-time high.
In 2024, the same segment stood at 21.1%, up 1.3 percentage points from 2023’s prior record.
Midsize Non-Premium SUVs captured 16.3% of 2025 U.S. new-vehicle sales, giving the two mainstream non-premium SUV classes a massive combined footprint.
Full-size SUVs are smaller by share, but they are expanding too.
Their market share grew to 3.5% in 2025, nearly double their 2013 level.
| U.S. SUV segment | Market share | Year |
|---|---|---|
| Compact Non-Premium SUV | 21.2% | 2025 |
| Midsize Non-Premium SUV | 16.3% | 2025 |
| Full-size SUV | 3.5% | 2025 |
| Compact Non-Premium SUV | 21.1% | 2024 |
Mainstream SUVs are carrying the category. The biggest gains are not just coming from luxury models or niche off-roaders, but from practical compact and midsize crossovers that have become default family vehicles.
Retail split data supports that.
Non-luxury SUVs made up 78.02% of new U.S. retail SUV registrations through March 2025, versus 21.91% for luxury and exotic SUVs.
Top SUV brands and best-selling SUV models in the U.S.
The U.S.
SUV leaderboard is competitive, but a handful of brands control a large share of the market.
In 2024 U.S.
SUV sales, General Motors led with 15.6% share, followed by Toyota at 13.3%, Hyundai-Kia at 12.6%, Ford at 9.6%, and Honda at 9.4%.
Honda was also identified as the fastest-growing SUV brand in 2024.
| Leading U.S. SUV groups/brands | 2024 market share |
|---|---|
| General Motors | 15.6% |
| Toyota | 13.3% |
| Hyundai-Kia | 12.6% |
| Ford | 9.6% |
| Honda | 9.4% |
Experian’s retail registration data tells a slightly different story at the make level for the 12 months ending March 2025:
- Toyota led new retail SUV registrations with 10.10% share.
- Honda ranked second with 9.57%.
- The Honda CR-V alone held a 6.42% share of new U.S. retail SUV registrations.
At the model level, the headline stat is hard to miss: the Toyota RAV4 was America’s best-selling vehicle in calendar 2024 with 475,193 units sold.
That result matters because it means an SUV did not just lead its segment—it led the entire U.S. vehicle market.
- Toyota RAV4: 475,193 U.S. sales in 2024
- Honda CR-V: 402,791 U.S. sales in 2024
- RAV4 lead over CR-V: 72,402 units in 2024
- RAV4 2024 growth: up 9.3% year over year
- CR-V 2024 growth: up 11.44% year over year
- RAV4 2025 U.S. sales: 479,288, up 0.86% from 2024
| Best-selling U.S. SUVs | Sales | Change |
|---|---|---|
| Toyota RAV4 | 475,193 (2024) | +9.3% |
| Honda CR-V | 402,791 (2024) | +11.44% |
| Toyota RAV4 | 479,288 (2025) | +0.86% vs. 2024 |
Hybrid demand is adding another layer to the RAV4 story.
In 2025, 35% of RAV4 sales came from hybrid variants, and those models achieved 39 mpg combined.
SUV pricing, weight, and fuel economy benchmarks
The average U.S.
SUV transaction price reached $43,000 in 2025, making the category not only dominant but also financially significant for automakers and households alike.
Growth in SUV share has also reshaped vehicle size and efficiency averages across the broader fleet.
Average new U.S. vehicle weight reached 4,354 pounds in model year 2024, about 6% above 2004 levels, a shift the EPA linked to market movement toward SUVs.
EPA-related data also shows notable differences within the SUV category itself:
- Car SUVs averaged 3,986 pounds.
- Truck SUVs averaged 4,578 pounds.
- Car SUV real-world fuel economy averaged 37 mpg.
- Truck SUV real-world fuel economy averaged 25 mpg.
- Truck SUV fuel economy rose to a record 25.7 mpg in model year 2024.
Truck SUVs are nearly 600 pounds heavier than car SUVs on average and deliver substantially lower fuel economy, even as efficiency records improve.
Production data shows where manufacturers are leaning.
Truck SUVs increased to nearly 50% of all new U.S. vehicle production in model year 2024, while combined car and truck SUVs accounted for 60% of all new vehicles produced.
Electric SUV statistics show the segment shaping EV adoption too
SUV dominance is no longer limited to internal combustion vehicles.
It is increasingly defining the electric market as well.
Electric SUVs represented 8% of the U.S.
SUV segment in 2025, with the Tesla Model Y leading at 146,000 units sold through Q2.
The next tier is developing quickly.
The Chevrolet Equinox EV sold 27,749 units in the first half of 2025, making it the best-selling non-Tesla electric SUV.
Luxury registration data highlights Tesla’s outsized position:
- Tesla led luxury and exotic new retail SUV registrations with a 20.18% market share by make.
- The Tesla Model Y held a 19.27% share of new U.S. luxury SUV retail registrations.
Broader EV mix data shows utility shapes now dominate electrified demand:
- Light trucks comprised 82% of U.S.
EV sales in Q4 2025.
- BEV and PHEV utility vehicles represented 73% of quarterly EV volume.
- SUVs represented more than three-quarters of both new ICE and new electric car sales in the U.S. in 2025.
- Over 85% of U.S. electric model offerings are large cars or SUVs.
The U.S.
EV market is not becoming sedan-first. It is following the same path as the broader auto market, with SUVs serving as the default format for new electric offerings and purchases.
Global SUV statistics: more than half of car sales worldwide now come from SUVs
The global picture mirrors the U.S. trend, but at an even larger scale.
Approximately 41 million SUV units were sold globally in 2024, and SUVs captured 54% of total global car sales.
In other words, more than one out of every two cars sold worldwide was an SUV.
That growth built on a strong 2023, when global SUV sales totaled 36.72 million units, up 16% year over year, accounting for nearly 47% of global passenger car sales.
Global SUV share jumped from nearly 47% in 2023 to 54% in 2024, a sharp increase that pushed the body style into majority status worldwide.
China was the largest global SUV market in 2024 with 11.6 million units sold.
In 2023, China and USA-Canada combined accounted for 54% of global SUV sales, showing just how concentrated global demand remains in a few major regions.
Among global subsegments, mid-size SUVs accounted for over 19 million units sold in 2024, making them the single biggest product cluster in the category.
| Global SUV statistics | Figure |
|---|---|
| Global SUV sales, 2024 | ~41 million |
| Global SUV share of car sales, 2024 | 54% |
| Global SUV sales, 2023 | 36.72 million |
| 2023 SUV sales growth | 16% |
| China SUV sales, 2024 | 11.6 million |
| Mid-size SUV sales globally, 2024 | 19 million+ |
Several regional milestones stand out too:
- Europe recorded 1.3 million electric SUV sales in 2024.
- India surpassed 2 million SUV sales for the first time in 2024.
- Asia-Pacific commanded 38.89% of the global SUV market in 2024.
Global SUV market size and growth forecasts
Beyond unit sales, the segment has become one of the most valuable areas in the auto industry.
Polaris Market Research valued the global SUV market at $871.59 billion in 2025 and projects it will reach $1.52367 trillion by 2034, representing a 6.4% CAGR.
Mordor Intelligence placed the 2025 global SUV market slightly higher at $890 billion and forecasts $1.23 trillion by 2030 at a 6.66% CAGR.
Technavio expects the SUV market to grow by $266.7 billion between 2024 and 2029 at a 5.4% CAGR.
| Global SUV market forecast | Valuation / growth |
|---|---|
| Polaris Market Research (2025) | $871.59 billion |
| Polaris 2034 forecast | $1.52367 trillion |
| Polaris CAGR | 6.4% |
| Mordor Intelligence (2025) | $890 billion |
| Mordor 2030 forecast | $1.23 trillion |
| Mordor CAGR | 6.66% |
| Technavio growth 2024–2029 | $266.7 billion |
| Technavio CAGR | 5.4% |
Global best-selling SUV statistics
The race for the world’s best-selling SUV was exceptionally close in 2024.
The Toyota RAV4 was the world’s best-selling SUV with 1,187,000 units registered globally.
The Tesla Model Y was right behind at 1,185,000, a gap of just 2,000 units.
The Honda CR-V ranked fourth globally with 854,000 units sold, including the China-market Breeze variant.
| Top global SUVs | 2024 units |
|---|---|
| Toyota RAV4 | 1,187,000 |
| Tesla Model Y | 1,185,000 |
| Honda CR-V | 854,000 |
2,000 units separated the RAV4 and Model Y globally in 2024, making the battle for the top SUV spot one of the tightest in the industry.
SUV safety statistics and pedestrian risk data
SUV growth is not only a sales story.
It also intersects with safety outcomes, especially for vulnerable road users.
U.S.
SUV occupant fatalities rose 1.6% to 7,013 in 2024, according to NHTSA early estimates.
Pedestrian data is especially notable.
The GHSA reported that light trucks, including SUVs, accounted for 54% of U.S. pedestrian fatalities where vehicle type was known in 2023.
A meta-analysis published in BMJ Injury Prevention found that being struck by an SUV or light truck increases adult pedestrian fatality odds by 44% compared with passenger cars.
As SUVs gain share, their safety footprint grows too. The same vehicle mix shift driving registrations, production, and pricing also changes the exposure profile for occupants and pedestrians.