Table of Contents
- SUV safety statistics show a split story: SUVs protect many occupants well, yet they remain deeply tied to rollover deaths and rising pedestrian harm.
- Table of contents
- SUV safety statistics overview
- SUV fatality and injury trends
- SUV safety rates vs cars, pickups, and vans
- SUV rollover safety statistics
- Seat belt and ejection statistics for SUVs
- SUV crash behavior statistics: alcohol, speeding, and crash patterns
- SUV model safety statistics and award data
- SUV pedestrian safety statistics
- SUV insurance and injury claim statistics
- Notable SUV safety facts and quick takeaways
SUV safety statistics show a split story: SUVs protect many occupants well, yet they remain deeply tied to rollover deaths and rising pedestrian harm.
That contrast is what makes the latest data so striking, especially as SUV occupant deaths climbed in 2024 even while broader safety technology and crash-prevention standards kept improving.
At a glance:
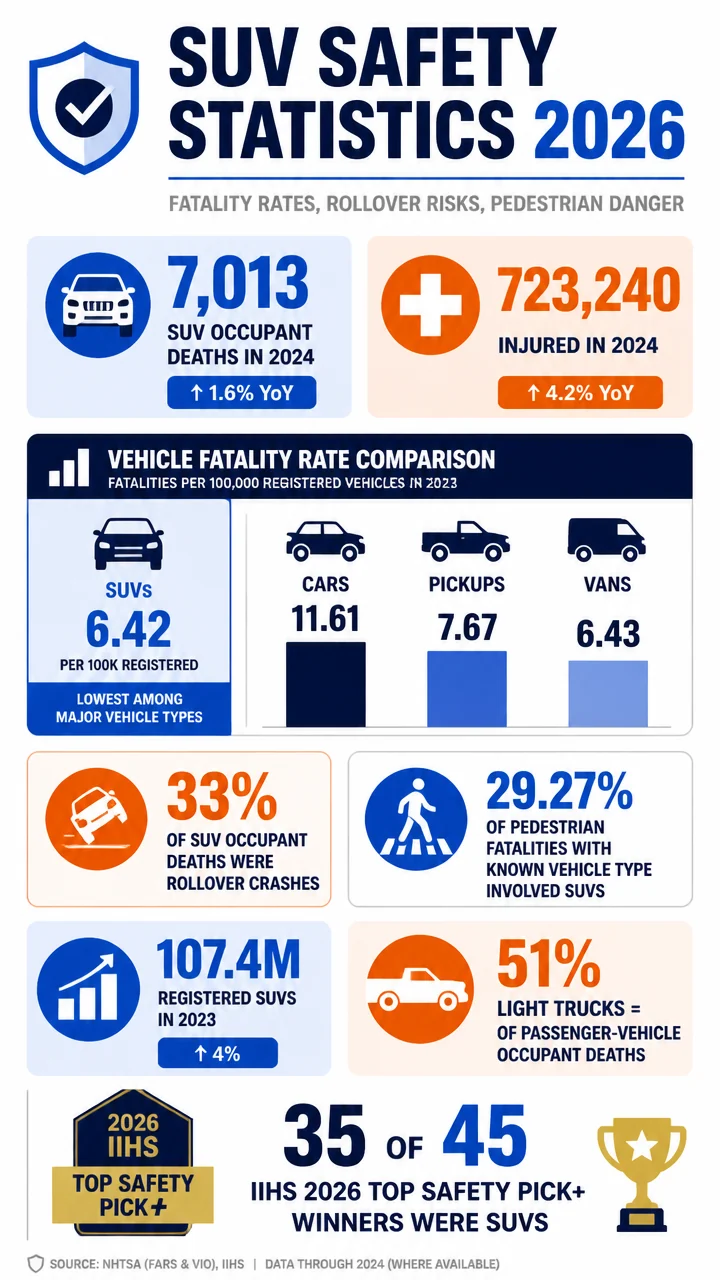
- 7,013 U.S.
SUV occupant fatalities occurred in 2024, up 1.6% from 2023.
- 723,240 SUV occupants were injured in U.S. crashes in 2024, up 4.2% year over year.
- 6.42 deaths per 100,000 registered SUVs was the 2023 occupant fatality rate, the lowest among cars, pickups, and vans.
- 33% of SUV occupant deaths in 2023 happened in rollover crashes.
- 29.27% of known-vehicle-type pedestrian fatalities in 2022 involved SUVs alone.
- 35 of 45 IIHS 2026 Top Safety Pick+ winners were SUVs.
Table of contents
- SUV safety statistics overview
- SUV fatality and injury trends
- SUV safety rates vs cars, pickups, and vans
- SUV rollover safety statistics
- Seat belt and ejection statistics for SUVs
- Alcohol, speeding, and crash pattern data
- SUV model and award data
- SUV pedestrian safety statistics
- Insurance and injury claim statistics
- Notable SUV safety facts
SUV safety statistics overview
The biggest headline is simple: SUV occupant safety looks relatively strong by rate, but total harm remains large by volume.
In 2024, 7,013 SUV occupants were killed in U.S. traffic crashes, up from 6,901 in 2023.
That was an increase of 112 deaths, or 1.6%, and it made SUV occupants one of only two major traffic-fatality categories that increased in 2024.
Injuries moved up even faster.
An estimated 723,240 SUV occupants were injured in U.S. crashes in 2024, up 28,952 from 2023, a 4.2% increase.
At the same time, 2023 rate-based metrics still made SUVs look comparatively safer for the people riding inside them.
The U.S.
SUV occupant fatality rate was 6.42 deaths per 100,000 registered SUVs, lower than passenger cars, pickups, and vans.
Big number: SUVs had 107,357,274 registered vehicles in the U.S. in 2023, up 4% from 2022.
That huge footprint helps explain why even relatively favorable rates still translate into thousands of deaths and hundreds of thousands of injuries.
SUV fatality and injury trends
SUV occupant deaths have not moved in a straight line. The data show a decline in 2023 followed by a reversal in 2024.
| Metric | 2022 | 2023 | 2024 | Change |
|---|---|---|---|---|
| SUV occupant fatalities | 7,121 | 6,888 to 6,901 | 7,013 | 2023 vs 2022: -3.3%; 2024 vs 2023: +1.6% |
| SUV occupant injuries | 624,248 | 694,259 | 723,240 | 2023 vs 2022: +11%; 2024 vs 2023: +4.2% |
| Registered SUVs | 102,758,301 | 107,357,274 | — | 2023 vs 2022: +4% |
| Injury rate per 100,000 registered SUVs | 607 | 647 | — | +7% |
One useful way to read these SUV safety statistics is to separate exposure from risk.
More SUVs on the road means more people riding in them, so large raw totals are partly a market-share story.
But increases in both fatalities and injuries still matter because they show harm moving upward, not just staying high.
7,013 SUV occupant deaths in 2024 represented about 17.9% of all U.S. traffic fatalities, based on 39,254 total deaths.
In 2023, light-truck occupants including SUV occupants accounted for 51% of all U.S. passenger vehicle occupant deaths, totaling 12,167 fatalities.
SUVs are now so central to the vehicle fleet that they dominate both safety gains and safety tradeoffs.
SUV safety rates vs cars, pickups, and vans
On occupant fatality rates, SUVs performed best among major passenger vehicle types in 2023.
| Vehicle type | Occupant fatality rate per 100,000 registered vehicles (2023) | Comparison to SUVs |
|---|---|---|
| SUVs | 6.42 | Baseline |
| Vans | 6.43 | Nearly identical |
| Pickups | 7.67 | Higher than SUVs |
| Passenger cars | 11.61 | Nearly double the SUV rate |
The gap versus cars is especially notable.
Passenger cars posted a fatality rate of 11.61 per 100,000 registered vehicles in 2023, compared with 6.42 for SUVs.
By travel exposure, the same pattern appears.
The 2023 occupant fatality rate per 100 million vehicle miles traveled was 0.66 for the broader light-truck category that includes SUVs, versus 1.13 for passenger cars.
Why it matters: These rate comparisons help explain why SUVs remain popular with family buyers.
On average, they deliver stronger occupant protection than cars, especially in multi-vehicle crashes.
That advantage becomes even clearer in crashes between cars and light trucks.
In 2023 fatal head-on crashes involving one passenger car and one light truck, car occupants were 2.9 times more likely to die than light-truck occupants.
When a light-truck front struck the side of a passenger car, car occupants were 14.4 times more likely to die.
Those are not niche events.
Fatal two-vehicle crashes involving one passenger car and one light truck totaled 3,655 in 2023, accounting for 26% of all fatal two-vehicle crashes and 10% of all fatal U.S. traffic crashes.
SUV rollover safety statistics
Rollover remains the defining SUV safety risk. Even though SUVs often protect occupants better than cars overall, their elevated rollover exposure continues to shape the fatality picture.
- 28% of all U.S. passenger vehicle occupant fatalities in 2023 involved rollover crashes.
- 33% of SUV occupant deaths occurred in vehicles that rolled over.
- Passenger cars were lower at 20%.
- Pickups were higher at 38%, the highest among major passenger vehicle types.
In raw numbers, U.S.
SUV occupant fatalities in rollover crashes totaled 2,307 in 2023.
That was down 11% from 2,595 in 2022, a meaningful improvement.
The rollover occupant fatality rate for SUVs also improved, falling to 2.15 deaths per 100,000 registered SUVs in 2023 from 2.53 in 2022, a 15% decline.
| Rollover metric | SUV statistic |
|---|---|
| Share of SUV occupant deaths involving rollover | 33% |
| SUV rollover occupant fatalities in 2023 | 2,307 |
| Year-over-year change from 2022 | -11% |
| Rollover fatality rate per 100,000 registered SUVs | 2.15 |
| Change in rollover fatality rate from 2022 | -15% |
| Rural fatal-crash SUVs experiencing rollover | 27% |
| Urban fatal-crash SUVs experiencing rollover | 11% |
Rural roads stand out sharply.
Among SUVs involved in rural fatal crashes in 2023, 27% experienced a rollover.
In urban fatal crashes, that figure was just 11%.
SUVs in rural fatal crashes were far more rollover-prone, with a rollover share more than double the urban figure.
Technology matters here.
NHTSA estimates electronic stability control, or ESC, prevents 84% of single-vehicle rollover crashes in light trucks, reduces single-vehicle SUV crashes by 59%, and cuts all fatal light-truck crashes by 29%.
Field data found ESC reduced fatal single-vehicle rollovers by 88% in light trucks and vans and reduced police-reported rollover crashes by 85%.
NHTSA also estimated that mandating ESC would prevent 1,161 to 1,445 fatalities annually.
For SUV safety, that makes ESC one of the most important interventions in the dataset.
Rollover resistance ratings matter too.
Vehicles with a 1-star rollover resistance rating are at least four times more likely to roll over in a single-vehicle crash than 5-star vehicles.
NHTSA gives a 5-star rollover rating when estimated single-vehicle rollover risk is 10% or less.
Seat belt and ejection statistics for SUVs
Seat belts remain one of the clearest SUV safety dividing lines. The latest numbers show high usage overall, but a large share of killed occupants were still unrestrained.
- Seat belt use among front-seat van and SUV occupants was 93.9% in the 2023 National Occupant Protection Use Survey.
- Lap/shoulder belts are estimated to reduce fatal injury risk by 60% for light-truck occupants.
- Those belts reduce moderate-to-critical injury risk by 65%.
- Wearing a seat belt reduces the chance of being killed in a rollover by about 75%.
Despite that, among U.S. daytime fatal crashes in 2023, 39% of killed SUV occupants were unrestrained.
At night, the share rose to 54%.
Fast facts:
- 39% of killed SUV occupants in daytime fatal crashes were unrestrained.
- 54% of killed SUV occupants in nighttime fatal crashes were unrestrained.
- SUVs had the lowest unrestrained share of any passenger vehicle type in daytime fatal crashes, but the nighttime figure still shows major risk.
Ejection is another major warning sign.
In fatal crashes in 2023, 20% of killed light-truck occupants, including SUV occupants, were totally ejected, compared with 13% of killed passenger car occupants.
And once total ejection occurs, survivability collapses: 82% of passenger vehicle occupants who were totally ejected in fatal 2023 crashes were killed.
SUV crash behavior statistics: alcohol, speeding, and crash patterns
SUV drivers in fatal crashes posted lower alcohol-impaired and speeding shares than passenger car drivers, but the levels are still substantial.
| Behavior in fatal crashes (2023) | SUV drivers | Passenger car drivers |
|---|---|---|
| Alcohol-impaired at BAC 0.08+ | 19% | 24% |
| Speeding involvement | 14% | 22% |
The comparison favors SUVs, but not by enough to dismiss driver behavior as a major factor.
Roughly 1 in 5 SUV drivers involved in fatal crashes were alcohol-impaired, and about 1 in 7 were speeding.
These statistics help explain why vehicle design and technology can improve outcomes without eliminating danger.
Better occupant protection reduces risk, but behavior still drives a meaningful share of fatal events.
SUV model safety statistics and award data
Model-level results show just how wide the safety spread can be inside the SUV category.
The overall U.S. driver death rate for 2020 and equivalent models during 2018-2021 was 38 deaths per million registered vehicle years.
Yet individual SUVs ranged from zero deaths to relatively high rates.
| Vehicle/model statistic | Figure |
|---|---|
| 2020 Nissan Pathfinder 2WD midsize SUV | 0 driver deaths per million registered vehicle years |
| 2020 BMW X3 4WD midsize luxury SUV | 0 driver deaths per million registered vehicle years |
| 2020 Toyota RAV4 hybrid 4WD small SUV | 16 driver deaths per million registered vehicle years |
| 2020 Chevrolet Trax 2WD small SUV | 89 driver deaths per million registered vehicle years |
| 2020 Buick Encore 4WD small luxury SUV | 6 other-driver deaths per million registered vehicle years |
That spread is a reminder that “SUV” is not a safety verdict by itself.
Size, crashworthiness, crash avoidance systems, and model-specific design still matter a great deal.
Broader IIHS findings reinforce that point:
- 18 of the 23 vehicle models with the lowest driver death rates for 2020 models were minivans or SUVs.
- Minicars averaged 153 driver deaths per million registered vehicle years, the highest vehicle class.
- Very large luxury cars averaged just 4, the lowest vehicle class.
- The overall other-driver death rate was 53 deaths per million registered vehicle years.
- Very large pickups averaged 121 other-driver deaths per million registered vehicle years, the highest class.
2026 awards snapshot:
- 35 of 45 IIHS 2026 Top Safety Pick+ winners were SUVs.
- 12 of 18 IIHS 2026 Top Safety Pick winners were SUVs.
- The 2026 Hyundai Kona was the cheapest Top Safety Pick+ small SUV at $25,500.
The award pool also got harder to reach.
Only 48 vehicle models qualified for IIHS Top Safety Pick or Top Safety Pick+ in 2025, down from 71 in 2024 after tougher criteria were introduced.
Crash avoidance is improving, though.
More than 70% of 2025 model-year vehicles IIHS evaluated earned acceptable or good ratings in the updated vehicle-to-vehicle front crash prevention test, and more than 77% of 2026 models tested so far meet that standard.
SUV pedestrian safety statistics
This is where the SUV safety story becomes much less favorable. Occupant protection gains do not automatically translate into safer outcomes for people outside the vehicle.
Light trucks including SUVs accounted for 54.1% of U.S. pedestrian fatalities in 2023 where the striking vehicle type was known.
Passenger cars accounted for 37.3%, and large trucks for 7.3%.
Looking specifically at SUVs, they alone accounted for 29.27% of U.S. pedestrian fatalities with known striking vehicle type in 2022, totaling 1,912 deaths.
| Pedestrian safety metric | Statistic |
|---|---|
| Light trucks’ share of known-type pedestrian fatalities, 2023 | 54.1% |
| Passenger cars’ share, 2023 | 37.3% |
| Large trucks’ share, 2023 | 7.3% |
| SUV share of known-type pedestrian fatalities, 2022 | 29.27% |
| SUV-involved pedestrian deaths, 2022 | 1,912 |
| Increase in pedestrian deaths involving light trucks, 2012-2022 | 76.7% |
| Increase for passenger cars, 2012-2022 | 24.9% |
The trend line is especially concerning.
Light trucks represented 51.9% of pedestrian fatalities with known vehicle type in 2022, up from 43.8% in 2012.
Over that same 2012-2022 span, pedestrian deaths involving light trucks rose 76.7%, versus 24.9% for passenger cars.
Adult pedestrians or cyclists struck by an SUV or light truck face 44% higher odds of death than if struck by a passenger car, according to a BMJ meta-analysis of 682,509 crash victims.
The same BMJ meta-analysis found even worse relative outcomes for children:
- 82% higher odds of fatality for children struck by an SUV or light truck versus a passenger car.
- 28% higher odds of killed-or-seriously-injured outcomes for children.
- For adults, odds of killed-or-seriously-injured outcomes were 24% higher.
Additional research estimated that replacing all light trucks with cars would have averted more than 8,000 pedestrian deaths between 2000 and 2019.
Vehicle design likely plays a large role.
GHSA cited IIHS findings that vehicles with higher front ends and blunt profiles are 45% more likely to cause pedestrian fatalities than lower-profile cars.
The long-term fleet shift helps explain the exposure change.
Vehicles in U.S. fatal crashes averaged 1,931 kg in 2019, up 10.7% from 1,745 kg in 2000 as SUVs expanded market share.
Over the same period, SUVs rose from 13.5% to 21.5% of vehicles involved in fatal crashes.
SUV insurance and injury claim statistics
Insurance data generally support the idea that SUVs provide better occupant protection than cars, even though repair costs have risen.
For 2021-2023 U.S. models, collision claim frequency averaged 6.2 claims per 100 insured vehicle years across all passenger vehicles.
Passenger cars including minivans had the highest collision claim frequency at 7.7.
HLDI also reports that MedPay and PIP injury claim frequencies are generally lower for SUVs and pickups than for cars because heavier vehicles provide more occupant protection.
- Large or very large pickups had the lowest personal injury protection claim frequency at about 3%.
- Micro and minicars had the highest personal injury claim frequency at about 8%.
- Historical HLDI data show U.S.
SUV collision claim severity rose 35% between 2005 and 2016.
That combination is important: SUVs may produce fewer injury claims on average than cars, but when damage happens, the bills can still become more expensive over time.
Notable SUV safety facts and quick takeaways
Key takeaways
- SUV occupant fatality rates are relatively low compared with cars, pickups, and vans.
- Total SUV occupant deaths still increased in 2024, showing that broad safety progress has not eliminated risk.
- Rollover remains the signature SUV hazard, especially in rural fatal crashes.
- Seat belt use is high, but unrestrained deaths remain common, especially at night.
- ESC is one of the most powerful SUV safety technologies in the dataset, with very large estimated rollover reductions.
- SUVs perform much worse from a pedestrian-safety perspective than from an occupant-safety perspective.
- Not all SUVs are equally safe; model-level death rates range from zero to well above the overall average.
One of the most surprising SUV safety statistics is that SUVs can be both safer for their own occupants and more dangerous for others. That tension runs through nearly every major number in the dataset.
Another standout figure: Montana had the highest state share of pickup and SUV occupant deaths, with those occupants making up 50% of motor vehicle crash deaths in 2023.
And if you want one simple summary of the entire landscape, it is this: SUV safety is strong inside the cabin, uneven in rollover scenarios, and far more troubling for pedestrians.