Table of Contents
- SUV rollover statistics at a glance
- Table of contents
- Latest SUV rollover statistics
- SUV rollover fatality trends over time
- SUV rollover share and vehicle-type benchmarks
- SUV rollover statistics by rural vs urban crashes
- SUV rollover crash patterns and initial impacts
- SUV rollover risk factors: age, alcohol, size, and stability
- Electronic stability control and vehicle design statistics
- Historical SUV rollover data and long-run context
- Injury severity, seat belts, and roof strength statistics
SUV rollover statistics at a glance
Rollovers remain one of the most dangerous crash outcomes for SUV occupants, even as the latest U.S. data shows some improvement.
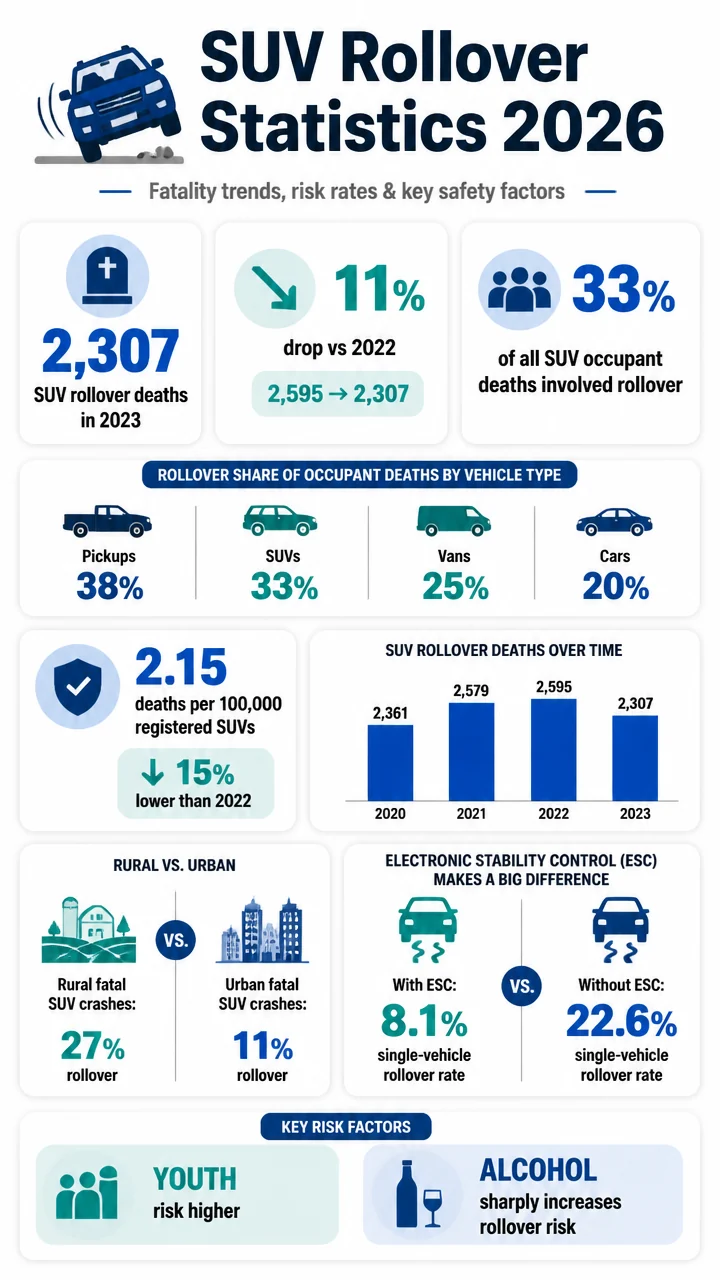
The biggest headline: 2,307 SUV occupants were killed in rollover crashes in 2023, and rollovers still accounted for about one-third of all SUV occupant deaths.
Big number: 2,307 SUV occupants were killed in rollover crashes in 2023, according to NHTSA.
Key takeaways
- SUV rollover occupant fatalities fell 11% from 2,595 in 2022 to 2,307 in 2023.
- 33% of SUV occupants killed in 2023 died in vehicles that rolled over, according to NHTSA.
- IIHS puts the 2023 SUV rollover death total at 2,266, equal to 34% of all SUV occupant deaths.
- Rural fatal SUV crashes were far more rollover-prone: 27% involved rollovers versus 11% in urban areas.
- ESC is one of the biggest safety storylines: SUVs with standard electronic stability control had an 8.1% single-vehicle rollover rate versus 22.6% without ESC.
- Alcohol and youth sharply increase rollover risk in single-vehicle SUV crashes.
Table of contents
- Latest SUV rollover statistics
- SUV rollover fatality trends over time
- SUV rollover share and vehicle-type benchmarks
- SUV rollover statistics by rural vs urban crashes
- SUV rollover crash patterns and initial impacts
- SUV rollover risk factors: age, alcohol, size, and stability
- Electronic stability control and vehicle design statistics
- Historical SUV rollover data and long-run context
- Injury severity, seat belts, and roof strength statistics
Latest SUV rollover statistics
2,307 SUV occupants were killed in rollover crashes in 2023, based on NHTSA’s Traffic Safety Fact Report for passenger vehicles.
That makes SUVs a major share of rollover deaths across the passenger vehicle fleet.
SUV occupants represented about 35% of all passenger vehicle rollover deaths in 2023, with 2,307 of the nation’s 6,596 total passenger vehicle rollover fatalities.
On a rate basis, the SUV rollover occupant fatality rate was 2.15 per 100,000 registered SUVs in 2023.
That figure matters because it adjusts for exposure and shows risk relative to the size of the vehicle population, not just raw fatality counts.
Fast facts
- 2,307 SUV rollover occupant fatalities in 2023
- 33% of SUV occupant deaths involved a rollover in NHTSA data
- 2.15 rollover occupant fatalities per 100,000 registered SUVs
- 35% of all passenger vehicle rollover deaths were SUV occupants
- 6,596 total passenger vehicle rollover fatalities in 2023
IIHS reports a very similar estimate from its Fatality Facts analysis of FARS data: 2,266 SUV occupants died in rollover crashes in 2023.
In that analysis, 34% of all SUV occupant deaths involved a rollover.
Those two sources differ slightly in totals, but they point to the same practical takeaway: roughly one out of every three SUV occupant deaths still involves a rollover.
SUV rollover fatality trends over time
The most immediate trend is encouraging.
SUV rollover occupant fatalities fell 11% from 2,595 in 2022 to 2,307 in 2023.
That decline follows a more uneven recent pattern.
Fatalities were 2,361 in 2020, climbed to 2,579 in 2021, and then dropped back in 2023 after the 2022 high point.
| Year | SUV rollover occupant fatalities | Change |
|---|---|---|
| 2020 | 2,361 | — |
| 2021 | 2,579 | Up from 2020 |
| 2022 | 2,595 | Up slightly from 2021 |
| 2023 | 2,307 | Down 11% vs. 2022 |
NHTSA’s 2021 report also showed that SUV rollover fatalities rose 9% from 2,361 in 2020 to 2,566 in 2021.
Whether you use the table total of 2,579 or the report comparison figure of 2,566, the broad story is the same: rollover deaths rose in the early 2020s before improving in 2023.
There is also an early sign of continued broad improvement in the wider market.
NHTSA estimated that overall U.S. passenger vehicle occupant fatalities in rollover crashes decreased 6% from 2023 to 2024.
That estimate is not SUV-specific, but it suggests the 2023 drop may fit into a larger downward trend.
Why it matters
A one-year decline is good news, but the absolute totals remain high.
Even after the 2023 improvement, SUV rollover deaths still numbered in the thousands nationwide.
33% of SUV occupants killed in 2023 died in vehicles that rolled over, according to NHTSA.
That puts SUVs in the upper tier of rollover exposure compared with other passenger vehicle types.
| Vehicle type | Share of occupant fatalities involving rollover, 2023 |
|---|---|
| Pickups | 38% |
| SUVs | 33% |
| Vans | 25% |
| Passenger cars | 20% |
That means SUVs ranked below pickups at 38% but above vans at 25% and passenger cars at 20% for rollover share of occupant fatalities in 2023.
In other words, SUVs remain notably more rollover-involved than cars.
The broader U.S. benchmark also reinforces that point: rollover crashes accounted for 28% of all passenger vehicle occupant fatalities in 2023, while SUVs were higher at 33% to 34% depending on source.
Pull quote: SUVs made up about 35% of all passenger vehicle rollover deaths in 2023.
This is one of the most important SEO takeaways in the dataset: SUVs are not the highest-risk vehicle type on every measure, but they remain disproportionately represented in fatal rollover outcomes compared with passenger cars.
SUV rollover statistics by rural vs urban crashes
Rural roads remain a major rollover danger zone for SUVs. In 2023, 27% of rural fatal passenger vehicle crashes involving SUVs included a rollover, compared with just 11% of urban fatal SUV crashes.
| Crash setting | Share of fatal SUV crashes involving rollover, 2023 |
|---|---|
| Rural | 27% |
| Urban | 11% |
That is a gap of 16 percentage points, and rural fatal SUV crashes were roughly 2.5 times as likely to involve a rollover as urban fatal SUV crashes.
The same pattern appeared in 2021, when SUV rural fatal crash rollover rate was 30% versus 13% in urban areas.
So this is not a one-off fluctuation; it is a stable pattern in the data.
At a glance
- Rural fatal SUV crashes involving rollover: 27% in 2023
- Urban fatal SUV crashes involving rollover: 11% in 2023
- 2021 comparison: 30% rural vs.
13% urban
For readers looking for the practical implication, this suggests rollover risk is strongly tied to the kinds of roads and crash circumstances seen more often in rural driving environments.
SUV rollover crash patterns and initial impacts
IIHS provides a more granular look at how SUV rollover deaths happen.
In 2023, 45% of SUV occupant deaths occurred in single-vehicle crashes, and 24% of all SUV occupant deaths occurred in single-vehicle rollover crashes.
Among SUV rollover deaths specifically, the initial impact pattern is striking:
- 1,017 deaths, or 45% of SUV rollover deaths, happened in crashes with frontal initial impact.
- 377 deaths, or 17%, happened in rollovers with side initial impact.
- 568 deaths, or 25%, happened in rollovers with no prior impact.
| Rollover crash pattern | SUV occupant deaths, 2023 | Share of SUV rollover deaths |
|---|---|---|
| Frontal initial impact | 1,017 | 45% |
| No prior impact | 568 | 25% |
| Side initial impact | 377 | 17% |
The biggest segment was frontal-impact rollovers, not pure “trip and flip” events with no prior impact.
That matters because it shows many fatal SUV rollovers are part of a broader crash sequence rather than isolated overturns.
Pull quote: One in four SUV rollover deaths in 2023 occurred in crashes with no prior impact.
SUV rollover risk factors: age, alcohol, size, and stability
Some of the most revealing SUV rollover statistics come from single-vehicle crash data in the NASS-GES study period.
Across weighted 2001-2006 data, 20.2% of SUVs in single-vehicle crashes rolled over.
But rollover risk was far from evenly distributed.
- Drivers under age 25 had a 29.6% rollover rate, versus 17.8% for drivers 25 and older.
- Alcohol-involved SUV drivers had a 39.1% rollover rate, versus 18.9% when sober.
- Small SUVs had a 20.7% rollover rate, compared with 16.4% for large SUVs.
| Risk factor | Higher-risk group | Rollover rate | Comparison group | Rollover rate |
|---|---|---|---|---|
| Driver age | Under 25 | 29.6% | 25 and older | 17.8% |
| Alcohol involvement | Alcohol-involved | 39.1% | Sober | 18.9% |
| Vehicle size | Small SUVs | 20.7% | Large SUVs | 16.4% |
Notable findings
- Alcohol involvement more than doubled rollover rate in this SUV sample.
- Younger drivers faced sharply higher rollover risk than older drivers.
- Small SUVs rolled over more often than large SUVs in single-vehicle crashes.
These are older crash-study statistics, but they remain useful because they isolate behavioral and vehicle-related factors that help explain why rollover risk can spike in certain circumstances.
Electronic stability control and vehicle design statistics
Electronic stability control is one of the clearest anti-rollover success stories in the SUV data.
In the NASS-GES-based study, SUVs with standard ESC had an 8.1% single-vehicle rollover rate, compared with 22.6% for SUVs without ESC.
After adjustment, standard ESC made SUV rollover two-thirds less likely, with an adjusted odds ratio of 0.33.
IIHS separately found that electronic stability control cuts fatal single-vehicle rollover risk by 73%.
Adoption also moved quickly.
47.5% of model year 2006 SUVs in the study had ESC as standard equipment, while 96% of 2011 model-year SUVs had standard ESC, up from just 10% of 2002 models.
| ESC metric | Statistic |
|---|---|
| Single-vehicle rollover rate with standard ESC | 8.1% |
| Single-vehicle rollover rate without ESC | 22.6% |
| Adjusted odds ratio for rollover with ESC | 0.33 |
| IIHS estimate of reduction in fatal single-vehicle rollover risk | 73% |
| 2002 SUVs with standard ESC | 10% |
| 2011 SUVs with standard ESC | 96% |
Static stability factor, or SSF, is another major design measure tied to rollover resistance.
SUVs with SSF at or above 1.20 had an 8.4% rollover rate, versus 22.0% for SUVs below 1.20.
Higher SSF cut rollover odds by 69%, with an adjusted odds ratio of 0.31.
NHTSA’s star ratings translate those engineering differences into estimated risk bands.
Five-star NCAP rollover ratings indicate less than 10% estimated rollover risk in a single-vehicle crash, while one-star ratings indicate greater than 40% estimated rollover risk.
Historical SUV rollover data and long-run context
The long-run trend helps explain why SUV rollover statistics still get so much attention.
Historically, SUVs were much more rollover-prone than passenger cars.
NHTSA fleet data found that 59% of SUV occupant fatalities historically occurred in vehicles that rolled over, the highest share among passenger vehicle types.
In the same historical analysis, the SUV rollover occupant fatality rate was 10.22 per 100,000 registered vehicles, compared with 3.83 for passenger cars.
Vehicle geometry was a major reason.
Sales-weighted average static stability factor was 1.17 for SUVs versus 1.41 for passenger cars in model year 2003.
Typical SUV SSF values ranged from 1.05 to 1.20, while passenger cars typically ranged from 1.35 to 1.45.
Rollover-related injured occupant rates showed the same pattern in GES data cited by NHTSA: 20% for SUVs, compared with 13% for pickups and 9% for vans.
Even NCAP testing from 2001-2003 showed most SUVs landing in the middle rather than the safest range, with most SUVs receiving 2-star or 3-star rollover resistance ratings.
Historical perspective
- 59% of SUV occupant fatalities historically involved rollovers
- 10.22 SUV rollover occupant fatalities per 100,000 registered vehicles historically
- 3.83 for passenger cars in the same historical NHTSA analysis
- Typical SUV SSF: 1.05 to 1.20
- Typical passenger car SSF: 1.35 to 1.45
The newer data is better than the old data, but the historical gap explains why rollover prevention remains central to SUV safety engineering.
Injury severity, seat belts, and roof strength statistics
Rollovers are relatively uncommon crash events overall, but they are disproportionately deadly.
In 2014-2018 data used in a NHTSA evaluation, only about 2% of all U.S. traffic crashes involved rollover, yet rollovers caused 24% of fatalities.
That imbalance is a key reason SUV rollover statistics matter so much: the event is rare compared with all crashes, but the consequences are severe.
Protection systems and crashworthiness still make a measurable difference in rollover outcomes:
- Seat belt use lowers odds of severe injury for non-ejected rollover occupants by about 38%.
- Stronger vehicle roofs reduce odds of severe injury for non-ejected rollover occupants by about 14% per 1-unit peak strength-to-weight ratio increase.
Why it matters
Prevention remains the first line of defense, but when a rollover does happen, belt use and roof strength materially improve outcomes.
IIHS driver death rate data also shows how far SUV safety has come in the ESC era.
For 2005-08 models, SUV driver death rate was 28 per million registered vehicle years, compared with 56 for cars.
For those same SUV models, single-vehicle rollover driver death rate was 6 per million registered vehicle years.
Later improvements continued.
Rollover death rate for 2011 models was 5 per million registered vehicle years, less than one-quarter of the 2004 model rate.
Among 2011 models, two-thirds of vehicles with zero driver deaths were SUVs.
Looking at 1- to 3-year-old vehicles in 2023, IIHS found that all SUVs averaged 4 driver deaths per million registered vehicle years in single-vehicle rollovers.
Among those same 1- to 3-year-old SUVs, small SUVs also averaged 4, while a figure of 11 per million appears in the dataset for a 2023 SUV subgroup and highlights that rollover death rates can still vary sharply across segments.
Fast facts
- All SUVs in 2023: 4 driver deaths per million registered vehicle years in single-vehicle rollovers among 1- to 3-year-old models
- Small SUVs in 2023: 4 per million
- Rollover death rate for 2011 models: 5 per million
- Single-vehicle rollover driver death rate for 2005-08 SUV models: 6 per million