Table of Contents
- SUV reliability statistics: the quick reality check
- Table of contents
- Key takeaways from SUV reliability statistics
- SUV reliability trends and broader dependability benchmarks
- Software and connectivity problems in SUV reliability statistics
- SUV reliability statistics by powertrain
- Most reliable brands and award-winning SUV models
- Consumer Reports SUV reliability scores and notable model results
- SUV longevity statistics and 250,000-mile odds
- SUV repair cost and repair-frequency benchmarks
SUV reliability statistics: the quick reality check
SUVs dominate the market, but the data shows reliability is far from uniform across the segment.
The biggest surprises in 2026 are how much software issues now shape owner complaints, how sharply results vary by powertrain, and which SUVs stand out for long-term durability.
Big number: The 2026 J.D.
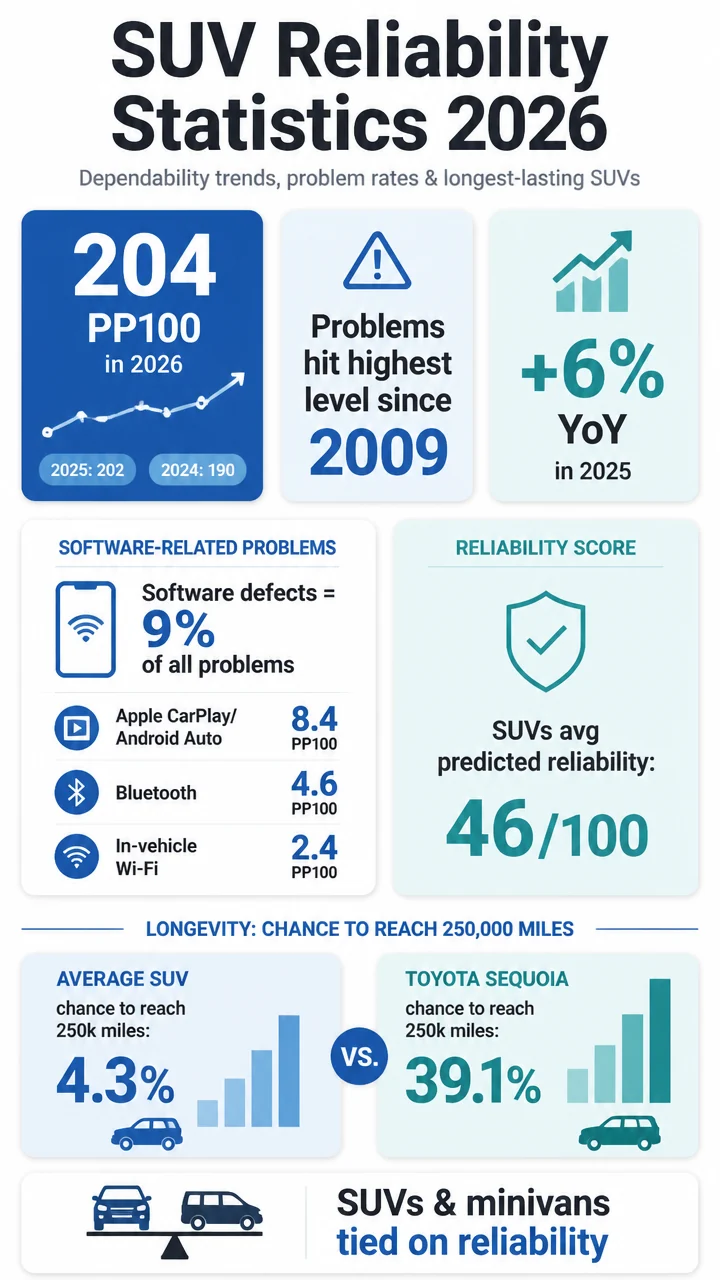
Power Vehicle Dependability Study reported an industry average of 204 problems per 100 vehicles (PP100), up from 202 PP100 in 2025 and 190 PP100 in 2024.
At a glance
- 202 PP100 was the industry average in the 2025 J.D.
Power study after three years of ownership.
- Vehicle problems in 2025 reached the highest level since 2009.
- Consumer Reports gives SUVs and minivans a tied average predicted reliability score of 46/100.
- The average SUV has just a 4.3% predicted chance of reaching 250,000 miles, according to iSeeCars.
- The Toyota Sequoia leads SUV longevity with a 39.1% predicted chance of reaching 250,000 miles.
Table of contents
- Key takeaways from SUV reliability statistics
- SUV reliability trends and broader dependability benchmarks
- Software and connectivity problems in SUV dependability data
- SUV reliability statistics by powertrain
- Most reliable brands and award-winning SUV models
- Consumer Reports SUV reliability scores and notable model results
- SUV longevity statistics and 250,000-mile odds
- SUV repair cost and repair-frequency benchmarks
Key takeaways from SUV reliability statistics
- Reliability pressure is rising: J.D.
Power’s industry average moved from 190 PP100 in 2024 to 202 in 2025 and 204 in 2026.
- Software is a major culprit: 9% of all owner-reported problems in the 2025 J.D.
Power study were software-related.
- Smartphone integration is a repeat pain point: Android Auto and Apple CarPlay issues reached 8.4 PP100 in 2025, up from 6.3 PP100 in 2024.
- Hybrids outperformed other fuel types in the 2025 J.D.
Power study at 199 PP100.
- Plug-in hybrids were the most problematic fuel type in 2025 at 242 PP100.
- New model launches struggled: 2022 model-year launches averaged 241 PP100, versus 196 PP100 for carryover models.
- Some SUVs combine dependability and longevity: the Toyota RAV4, Lexus GX, Chevrolet Tahoe, and Nissan Murano appear in reliability award or endurance-focused data.
- Size matters for ownership costs: compact SUVs average $521 in annual repair costs, compared with $784 for fullsize SUVs.
SUV reliability trends and broader dependability benchmarks
The broad reliability trend is moving in the wrong direction. J.D.
Power reported an industry average of 190 PP100 in 2024, then 202 PP100 in 2025, followed by 204 PP100 in 2026.
That means owners of three-year-old vehicles are reporting more problems, not fewer.
The 2025 jump was especially sharp. Problems per 100 vehicles rose 6% year over year in the 2025 study, equal to a 12 PP100 increase versus 2024.
J.D.
Power also said vehicle problems after three years hit their highest level since 2009.
For SUV shoppers, that matters because SUVs sit in the middle of the reliability pack in Consumer Reports data.
Consumer Reports assigns SUVs and minivans a tied average predicted reliability score of 46 out of 100.
That trails cars at 58, but stays above pickup trucks at 44.
Why it matters: SUV reliability is not collapsing, but the data suggests modern vehicles are becoming harder to keep trouble-free because software, feature complexity, and newer powertrain combinations are adding more failure points.
| Dependability benchmark | Figure | Source context |
|---|---|---|
| 2024 industry average | 190 PP100 | J.D. Power VDS |
| 2025 industry average | 202 PP100 | J.D. Power VDS |
| 2026 industry average | 204 PP100 | J.D. Power VDS |
| 2025 year-over-year increase | +12 PP100 | Versus 2024 |
| 2026 year-over-year increase | +2 PP100 | Versus 2025 |
| Consumer Reports SUV predicted reliability | 46/100 | Tied with minivans |
| Consumer Reports car predicted reliability | 58/100 | Most reliable vehicle type |
| Consumer Reports pickup predicted reliability | 44/100 | Least reliable vehicle type |
Software and connectivity problems in SUV reliability statistics
Connectivity problems are now some of the most important reliability issues in the market. In the 2025 J.D.
Power study, Android Auto and Apple CarPlay connectivity was the top industry problem at 8.4 PP100, up from 6.3 PP100 a year earlier.
Bluetooth and in-vehicle internet also contributed. Built-in Bluetooth problems averaged 4.6 PP100, while in-vehicle Wi-Fi problems averaged 2.4 PP100.
Even more telling, five of the top 10 industry-wide problems were related to smartphone integration, usage, or connectivity.
J.D.
Power said software defects made up 9% of total owner-reported problems, and mass market brands saw a 16 PP100 increase tied in part to software defects.
The over-the-air update data does not exactly inspire confidence.
Thirty-six percent of owners said they performed an OTA software update during the first three years of ownership.
But only 30% of those owners reported an improvement afterward, while 56% said they noticed no improvement.
Fast facts
- 8.4 PP100: Android Auto and Apple CarPlay problems in 2025
- 4.6 PP100: Bluetooth system problems
- 2.4 PP100: In-vehicle Wi-Fi problems
- 9%: Share of all problems linked to software defects
- 36%: Owners who performed an OTA update
- 30%: OTA users who said the update improved things
This matters for SUV buyers because many of today’s SUVs are sold on cabin tech, touchscreens, phone integration, and connected services.
The data suggests those features can undermine dependability scores even when the underlying engine or drivetrain is performing well.
SUV reliability statistics by powertrain
Hybrids were the best-performing fuel type in the 2025 J.D.
Power Vehicle Dependability Study at 199 PP100.
Gasoline vehicles were close behind at 200 PP100.
Battery electric vehicles improved, but still lagged hybrids and gas. BEVs averaged 223 PP100 in 2025, which was a 33 PP100 improvement year over year from 256 PP100 in 2024.
Plug-in hybrids posted the worst score in 2025. PHEVs averaged 242 PP100, even after improving by 26 PP100 year over year.
Diesel vehicles came in at 233 PP100.
Consumer Reports data points in a similar direction.
It notes that 13 of the 26 brands’ least reliable models are either an EV or a PHEV.
By contrast, among about 30 hybrids in its survey, only the Hyundai Sonata Hybrid and Lincoln Nautilus Hybrid had below-average predicted reliability.
| Powertrain type | 2024 PP100 | 2025 PP100 | Change |
|---|---|---|---|
| Hybrid | 191 | 199 | +8 |
| Gasoline | 187 | 200 | +13 |
| Battery electric | 256 | 223 | -33 |
| Plug-in hybrid | 216 | 242 | +26 in absolute comparison shown by yearly values |
| Diesel | Not provided | 233 | — |
Most quotable stat: Plug-in hybrids were the most problematic powertrain type at 242 PP100 in the 2025 J.D.
Power study.
One more warning sign for SUV buyers: new designs often come with more reliability risk. Only 4 of 27 new models launched for the 2022 model year beat their segment dependability average.
Those new 2022 launches averaged 241 PP100, compared with 196 PP100 for carryover models.
Most reliable brands and award-winning SUV models
Lexus led the overall 2025 J.D.
Power brand rankings with 140 PP100. Among premium brands, Cadillac was second at 169 PP100, and Porsche was third at 186 PP100.
Buick led mass market brands at 143 PP100, followed by Mazda at 161 and Toyota at 162.
At the other end, Volkswagen anchored the 2025 rankings with 285 PP100.
For 2026, the premium side showed more strain.
J.D.
Power said premium vehicles jumped 8 PP100 year over year to 217 PP100, and the dependability gap between premium and mass market vehicles widened to 17 PP100.
Brand leaders by study
- 2025 overall leader: Lexus, 140 PP100
- 2025 top mass market brand: Buick, 143 PP100
- 2024 overall leader: Lexus, 135 PP100
- 2024 top mass market brand: Toyota, 147 PP100
At the model level, Toyota Motor Corporation and General Motors each received six model-level dependability awards in the 2025 J.D.
Power study.
| SUV segment | 2025 dependability award winner |
|---|---|
| Small SUV | 2022 Nissan Kicks |
| Compact SUV | 2022 Toyota RAV4 |
| Midsize SUV | 2022 Nissan Murano |
| Upper Midsize SUV | 2022 GMC Acadia |
| Large SUV | 2022 Chevrolet Tahoe |
| Midsize Premium SUV | 2022 Lexus GX |
| Upper Midsize Premium SUV | 2022 Cadillac XT6 |
That list is useful because it shows which SUVs actually led their segments in three-year dependability, not just which brands scored well overall.
Consumer Reports SUV reliability scores and notable model results
Consumer Reports paints a slightly different picture than J.D.
Power, but some themes overlap. Its latest Annual Auto Reliability Survey gathered data on about 380,000 vehicles from model years 2000 to 2025.
Among the strongest SUV-specific findings:
- Tesla Model Y was named the most reliable electric SUV and the most reliable EV overall in Consumer Reports’ latest survey.
- Honda Passport and Toyota 4Runner scored well above average.
- Lexus NX, Lexus NX Hybrid, and Lexus UX were listed as the three most reliable luxury small SUVs.
- Lexus RZ had the best predicted reliability among luxury electric SUVs.
- Jeep Grand Cherokee Plug-in Hybrid had well-below-average predicted reliability.
- Subaru Ascent was Subaru’s lowest-scoring SUV, though it still landed at average predicted reliability.
There are also broader brand-level patterns.
Asia-based automakers averaged a predicted reliability score of 56, while domestic U.S. brands averaged 41.
GMC ranked 24th out of 26 brands with a score of 28.
Notable low scores in 2026 Consumer Reports data
- 2026 GMC Acadia: 14/100 predicted reliability
- Rivian R1T: 18/100
- Mazda CX-90 Plug-in Hybrid: 20/100
The Acadia result is especially notable because the 2022 GMC Acadia won the J.D.
Power Upper Midsize SUV dependability award, yet the 2026 GMC Acadia scored just 14/100 in Consumer Reports predicted reliability.
That contrast is a reminder that three-year dependability data and predicted future reliability are related but not identical.
SUV longevity statistics and 250,000-mile odds
Reliability and longevity are not exactly the same, but long life is one of the clearest real-world signs of durable engineering. According to iSeeCars, the average SUV has a 4.3% predicted chance of reaching 250,000 miles.
The Toyota Sequoia blows that average away. It has a 39.1% predicted chance of reaching 250,000 miles, making it 9.1 times more likely than the average SUV to hit that milestone.
The top of the SUV longevity rankings is packed with familiar names:
- Toyota Sequoia: 39.1%
- Toyota 4Runner: 32.9%
- Toyota Highlander Hybrid: 31.0%
- Lexus GX: 18.3%
- Honda CR-V: 10.6%
- Chevrolet Tahoe: 7.7%
- Toyota RAV4: 7.3%
| SUV model | Predicted chance of reaching 250,000 miles |
|---|---|
| Toyota Sequoia | 39.1% |
| Toyota 4Runner | 32.9% |
| Toyota Highlander Hybrid | 31.0% |
| Lexus GX | 18.3% |
| Honda CR-V | 10.6% |
| Chevrolet Tahoe | 7.7% |
| Toyota RAV4 | 7.3% |
| Average SUV | 4.3% |
Across all vehicle body styles, SUVs took 11 of the top 25 spots in iSeeCars’ 2025 longest-lasting vehicle study, and 21 SUV models beat the segment’s average longevity rate.
There is also a useful “top 1%” mileage lens:
- Toyota Sequoia: the top 1% on the road averaged at least 296,509 miles
- Toyota 4Runner: the top 1% averaged at least 244,665 miles
- Honda CR-V: the top 1% averaged at least 215,930 miles
Big longevity stat: The Toyota Sequoia is 9.1 times more likely than the average SUV to reach 250,000 miles.
SUV repair cost and repair-frequency benchmarks
RepairPal data adds a practical ownership-cost layer to SUV reliability statistics. It shows how vehicle size often influences both reliability ratings and annual repair bills.
| SUV type | Reliability rating | Rank among vehicle types | Average annual repair cost | Other benchmark |
|---|---|---|---|---|
| Subcompact SUV | 4.0/5.0 | 1st of 19 | $466 | Highest vehicle-type rating |
| Compact SUV | 4.0/5.0 | 6th of 19 | $521 | 0.3 unscheduled visits/year; 11% severe repairs |
| Midsize SUV | 3.5/5.0 | 10th of 19 | $573 | — |
| Fullsize SUV | 3.0/5.0 | 14th of 19 | $784 | 15% severe repairs |
Compact SUVs remain one of the safer bets for cost-conscious buyers. RepairPal gives compact SUVs a 4.0 out of 5.0 reliability rating, ranking them 6th out of 19 vehicle types.
They average $521 in annual repair costs, 0.3 unscheduled repair shop visits per year, and 11% of repairs are considered severe.
Fullsize SUVs are materially more expensive to keep on the road. They score just 3.0 out of 5.0, rank 14th out of 19, average $784 in annual repairs, and see 15% of repairs classified as severe.
At the individual model level, two compact SUV benchmarks stand out:
- Honda CR-V: 4.5/5.0 reliability rating, 2nd of 26 compact SUVs, $407 average annual repair cost, and 9% probability of severe repairs
- Toyota RAV4: 4.0/5.0 reliability rating, 3rd of 26 compact SUVs, and $429 average annual repair cost
Key ownership takeaway: If you want the best mix of reliability, repair affordability, and segment-level consistency, the data most strongly favors subcompact and compact SUVs, with models like the Honda CR-V and Toyota RAV4 standing out.