Table of Contents
- SUV ownership statistics: the U.S. fleet has become an SUV nation
- SUV ownership statistics at a glance
- How many SUVs are on U.S. roads?
- SUV growth trends and fleet expansion statistics
- SUV age and fleet longevity statistics
- SUV ownership in the context of U.S. households
- Consumer preference and switch-to-SUV statistics
- SUV ownership statistics in the new and used market
- SUV segment, brand, and electric SUV ownership data
- SUV buyer demographics and household profile statistics
- Geographic SUV ownership and market concentration statistics
- Global SUV ownership statistics and China market context
SUV ownership statistics: the U.S. fleet has become an SUV nation
SUVs are no longer just a popular vehicle choice—they are the center of U.S. car ownership.
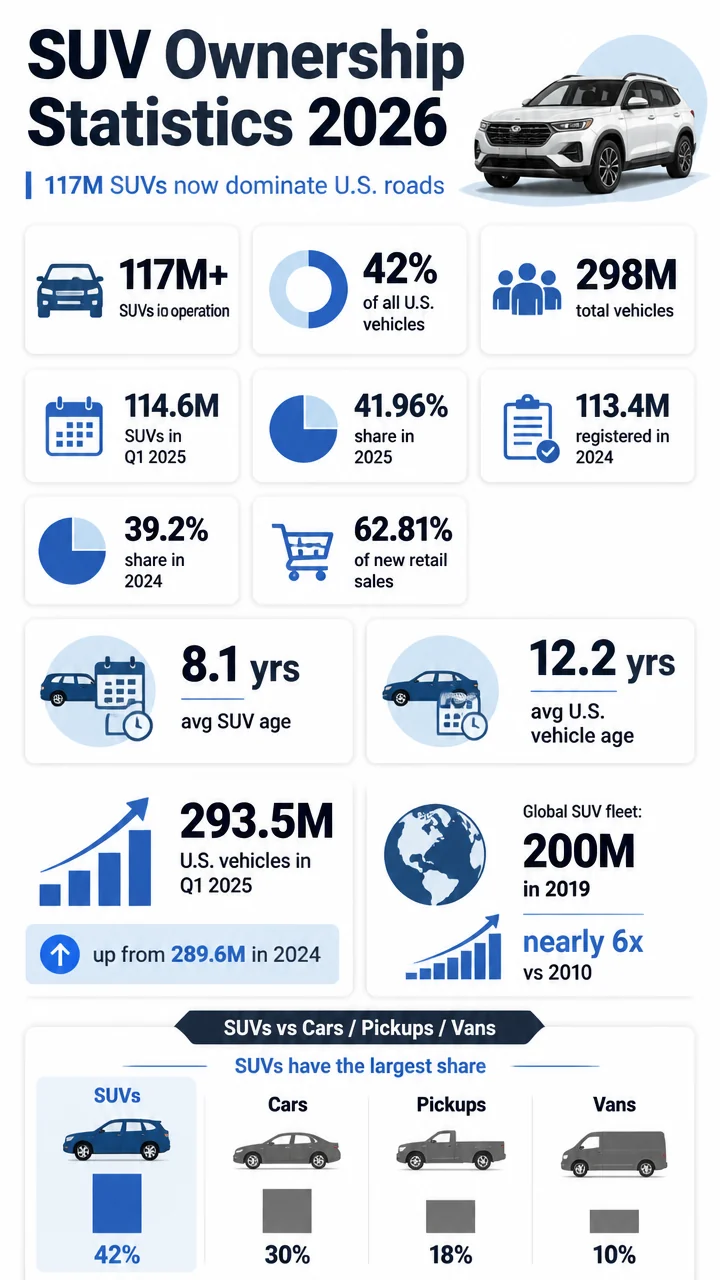
The latest data shows more than 117 million SUVs in operation in the U.S. through Q1 2026, putting them at roughly 42% of all vehicles on American roads.
That headline figure matters because it confirms a long-running shift: SUVs have moved from a fast-growing segment into the default American vehicle type across new sales, used registrations, and household ownership patterns.
- SUV ownership statistics at a glance
- How many SUVs are on U.S. roads?
- SUV growth trends and fleet expansion
- SUV age and fleet longevity statistics
- SUV ownership in the context of U.S. households
- Consumer preference and switch-to-SUV statistics
- New and used SUV market statistics
- SUV segment, brand, and electric SUV data
- SUV buyer demographics and household profiles
- Geographic and market concentration statistics
- Global SUV ownership and China market context
SUV ownership statistics at a glance
- 117 million+ SUVs were in operation in the U.S. through Q1 2026.
- 114.58 million SUVs were on U.S. roads as of March 31, 2025.
- 41.96% of all U.S. light-duty vehicles in operation in March 2025 were SUVs.
- 113,384,621 utility vehicles were registered at the end of 2024.
- 39.20% of all registered U.S. light-duty vehicles at the end of 2024 were utility vehicles.
- 62.81% of new retail vehicle registrations through March 2025 were SUVs.
- 38.78% of used retail registrations through March 2025 were SUVs.
- 8.1 years was the average age of SUV/CUVs in operation in 2023, the youngest of any major U.S. vehicle type.
- 66% of current SUV owners planning to buy in the next year intend to purchase another SUV.
- 25% of sedan owners planning a purchase expect to switch to an SUV or crossover.
How many SUVs are on U.S. roads?
The U.S.
SUV parc has passed 117 million vehicles. Through Q1 2026, Experian data cited via Epoch Times puts SUVs at more than 117 million units in operation, equal to about 42% of the nearly 298 million vehicles on U.S. roadways.
That figure builds on already huge 2025 and 2024 totals.
As of March 31, 2025, more than 114.58 million SUVs were in operation on U.S. roads, accounting for 41.96% of all light-duty vehicles in operation.
At the end of 2024, utility vehicles totaled 113,384,621 registered units and represented 39.20% of all registered U.S. light-duty vehicles.
The broader U.S. vehicle population also keeps climbing.
Total U.S. light-duty vehicles in operation reached 293.5 million in Q1 2025, up from 289.6 million in Q1 2024.
Another estimate puts total U.S. registered vehicles at 293.9 million in 2025.
| U.S. SUV fleet benchmark | Figure | Share of U.S. vehicles |
|---|---|---|
| End of 2024 registered utility vehicles | 113,384,621 | 39.20% |
| March 31, 2025 SUVs in operation | 114.58 million | 41.96% |
| Q1 2026 SUVs in operation | 117 million+ | ~42% |
SUV growth trends and fleet expansion statistics
The biggest story in SUV ownership is sustained growth over time. The U.S. fleet has expanded, but SUVs have grown faster than the market overall.
- The U.S. vehicle fleet totaled 286 million vehicles in operation in January 2024, up 2 million from 2023.
- By Q1 2025, light-duty vehicles in operation reached 293.5 million.
- By Q1 2026, the U.S. roadway fleet was estimated at roughly 298 million vehicles.
Within that larger fleet, light trucks have steadily taken share from passenger cars.
Light trucks including SUVs, pickups, and minivans made up roughly 61% of U.S. vehicle registrations in 2022.
At mid-year 2020, light trucks represented 56% of U.S. light-vehicle VIO, up from 51% in 2010 and 53% in 2015.
Passenger cars moved the other direction.
Cars fell from 49% of U.S. light-vehicle VIO in 2010 to 44% by mid-2020 as SUV and truck ownership expanded.
New-vehicle demand helps explain why ownership has followed this curve.
SUVs grew from about 30% of U.S. new-vehicle sales in 2010 to 48% in 2019, while cars fell from 50% to 28%.
Brand portfolios shifted with consumer demand.
In 2010, only six of 34 major U.S. auto brands sold a majority of SUVs, while 27 brands sold a majority of cars.
Jeep and Land Rover were already at 100% SUV mixes in 2010 and remained there through 2020.
Subaru sold 68% SUVs in 2010, while GMC sold 54%.
SUV age and fleet longevity statistics
SUVs are the youngest major vehicle type in operation. SUV/CUVs had an average age of just 8.1 years in 2023, the lowest of any U.S. vehicle category in operation.
| Vehicle type | Average age | Source year |
|---|---|---|
| SUV/CUVs | 8.1 years | 2023 |
| Cars | 11.9 years | 2023 |
| Vans | 11.8 years | 2023 |
| Pickup trucks | 13.1 years | 2023 |
That age gap is striking when set against the broader fleet.
The national average age of all registered U.S. vehicles was 12.2 years as of December 31, 2024, while the combined average age of U.S. cars and light trucks reached a record 12.6 years in 2024.
Another split shows how much newer truck-based ownership trends are.
Passenger cars averaged 14.0 years in operation in 2024 versus 11.9 years for light trucks.
S&P Global Mobility also expects vehicles aged 6–14 years to represent 70% or more of U.S. vehicles in operation for the next five years.
That matters for SUV ownership because much of the recent wave of SUV adoption is moving into the core used-vehicle age band.
SUV ownership in the context of U.S. households
SUV growth sits inside a very car-dependent household landscape. Approximately 92% of U.S. households owned at least one vehicle at the start of 2026.
- The average American household owned 2.28 vehicles.
- 35% of U.S. households owned three or more vehicles.
- 59% of households owned two or more vehicles in 2020, up from 22% in 1960.
- Households with zero vehicles declined from 22% in 1960 to 8.5% in 2020.
Those figures help explain why SUV ownership can keep rising even in a mature market.
Many American households are multi-vehicle households, which creates room for an SUV to become either the primary family vehicle or an added utility vehicle alongside another car or truck.
Consumer preference and switch-to-SUV statistics
Consumer preference now clearly leans toward SUVs and crossovers. YouGov data from 2024–2025 found that 41% of U.S. car owners said their primary vehicle is an SUV or crossover.
That put SUVs well ahead of sedans at 30% and trucks at 12%.
- 41% of owners say their main vehicle is an SUV or crossover.
- 66% of current SUV owners planning to buy in the next year intend to buy another SUV.
- 25% of sedan owners planning a vehicle purchase expect to switch to an SUV or crossover.
- 30% of truck owners say their next vehicle may be an SUV.
This is one of the clearest signs of category durability.
SUV owners are not just buying in; they are staying in.
A 66% repurchase intention among current SUV owners points to strong loyalty.
The category is also still pulling share from elsewhere.
A quarter of sedan owners planning a purchase expect to move into an SUV or crossover, and nearly a third of truck owners say their next vehicle may be an SUV.
By December 2025, crossovers accounted for 49% of U.S. vehicle market share and traditional SUVs another 10%.
Combined, SUVs and crossovers reached 59% of the market in that ownership framing.
SUV ownership statistics in the new and used market
New registrations show SUVs dominating purchase behavior. In the 12 months through March 2025, 62.81% of U.S. new retail vehicle registrations were SUVs.
That translated into more than 7.94 million new retail SUVs registered in the U.S. over that period.
The used market is also heavily SUV-driven.
More than 8.2 million used retail SUVs changed registration in the 12 months through March 2025, representing 38.78% of all used retail registrations.
Broader used-market data confirms the same pattern.
SUVs represented 42.6% of U.S. used-car market unit volume in 2025, while another report put SUVs and crossovers together at approximately 43% of the U.S. used-car market.
| Market measure | Figure |
|---|---|
| New retail vehicle registrations that were SUVs | 62.81% |
| New retail SUVs registered | 7.94 million+ |
| Used retail SUVs changing registration | 8.2 million+ |
| Used retail registrations that were SUVs | 38.78% |
| Used-car market unit volume that was SUVs | 42.6% |
These registration figures matter because ownership statistics are built from both first owners and later owners.
A healthy used SUV market helps preserve and spread SUV ownership across income levels and household types.
The scale of used movement is especially notable in a market where 39.3 million U.S. used vehicles changed owners in the 12 months through Q1 2025, while 12.2 million vehicles went out of operation.
SUV segment, brand, and electric SUV ownership data
Midsize SUVs are the center of the new market. Among new retail U.S.
SUV registrations in the 12 months through March 2025, midsize SUVs accounted for 51.86%, compact SUVs for 28.77%, and large SUVs for 19.36%.
| New SUV registration mix | Share |
|---|---|
| Midsize SUVs | 51.86% |
| Compact SUVs | 28.77% |
| Large SUVs | 19.36% |
| Non-luxury SUVs | 78.02% |
| Luxury SUVs | 21.90% |
| Exotic SUVs | 0.08% |
Most SUV ownership growth remains mainstream.
Non-luxury SUVs made up 78.02% of new retail SUV registrations, compared with 21.90% for luxury and just 0.08% for exotic SUVs.
On powertrains, gas and diesel still dominate the category, accounting for 73.73% of new retail SUV registrations.
BEV SUVs represented 10.47%, while other alternative-fuel SUVs made up 15.80%.
Another framing puts electric SUVs at 10.5% of new U.S.
SUV registrations over the last 12 months through Q1 2025.
Brand shares show how fragmented but concentrated the market is.
Toyota held a 10.10% share of U.S. new retail SUV registrations by make in the 12 months through March 2025, with Honda at 9.57%.
Among nameplates, the Honda CR-V led non-luxury new retail SUV registrations with a 6.42% segment share.
In luxury and exotic SUVs, the Tesla Model Y held a 19.27% share, while Tesla led at the make level with a 20.18% share and Lexus held 14.65%.
The Model Y alone captured 40.46% of new retail electric SUV registrations by model.
Used-SUV rankings were more spread out.
Among 1- to 5-year-old used SUVs sold in the U.S. in 2025, the Chevrolet Equinox held a 3.0% share, the Nissan Rogue 3.0%, and the Ford Explorer 2.6%.
SUV buyer demographics and household profile statistics
SUV ownership and buying skew older, family-oriented, and suburban. Gen X buyers accounted for 31.66% of new retail U.S.
SUV registrations in the 12 months through March 2025, narrowly ahead of Baby Boomers at 31.08%.
Millennials represented 23.67%, while Gen Z accounted for 7.96%.
| Buyer demographic | Share of new retail SUV registrations |
|---|---|
| Gen X | 31.66% |
| Baby Boomers | 31.08% |
| Millennials | 23.67% |
| Gen Z | 7.96% |
| Male | 53.15% |
| Female | 46.85% |
Buying patterns also vary by vehicle size.
Gen Z SUV buyers over-index for compact SUVs, while Millennials and Gen X over-index for large SUVs.
By gender, male buyers accounted for 53.15% of new retail SUV registrations and female buyers 46.85%.
Men over-index for large SUVs and under-index for compact SUVs, while women show the reverse pattern.
- 86.88% of new retail SUV registrations came from married buyers.
- 91.86% of new large SUV registrations came from married buyers.
- 56.71% of new retail SUV registrations came from buyers with children.
- Buyers with children over-index for large SUVs.
- 85.36% of new retail SUV registrations came from single-family-home buyers.
Income and housing markers reveal a strong segmentation ladder.
Compact SUV buyers over-index at household incomes of $75,000 and under, while large SUV buyers over-index at $250,000 and above.
Compact SUV buyers also over-index among homeowners with property values under $250,000, while $1 million+ home values over-index for midsize SUVs.
Occupation data adds another layer: professional occupations made up the largest buyer segment at 18% of new retail SUV registrations.
Geographic SUV ownership and market concentration statistics
Electric SUV demand is highly concentrated in a few states. California alone accounted for 30.67% of U.S. new retail electric SUV registrations in the 12 months through March 2025.
- California: 30.67% of new retail electric SUV registrations
- Florida: 8.7%
- Texas: 6.9%
That means California’s electric SUV footprint was more than triple Florida’s and more than four times Texas’s share in the same period.
On broader market geography, the New York DMA led the U.S. in both new and used retail SUV registrations.
It posted more than 135,000 new retail SUV registrations and more than 620,000 used retail SUV registrations in the 12 months through March 2025.
Global SUV ownership statistics and China market context
The SUV boom is not just American. The global SUV fleet reached 200 million vehicles in operation in 2019, nearly six times the 2010 level.
China provides useful context for how large SUV influence has become in major auto markets.
China had a total vehicle stock of 435 million at the end of 2023, including 336 million passenger cars.
It had approximately 200 light-duty passenger vehicles per 1,000 population in 2020, and its private passenger-car parc was estimated at roughly 320–330 million units in 2026.
Ownership structure in China also remains heavily consumer-driven, with individual private buyers holding a 72.55% share of the country’s automotive ownership model in 2025.
SUVs accounted for 49.7% of China’s passenger-vehicle sales in the first half of 2024.
For U.S. readers, the takeaway is simple: SUV ownership growth is part of a global structural shift, but the United States remains one of the clearest examples of SUVs becoming the mainstream vehicle form.