Table of Contents
- SUV accident statistics show a split story
- Table of contents
- Key takeaways
- Overall SUV accident statistics
- SUV fatality and injury trends
- SUV crash types and rollover statistics
- Driver, passenger, and behavior data
- SUV vs. car crash compatibility statistics
- SUV driver death rates by size
- Pedestrian and cyclist statistics
- State-level SUV fatality statistics
- SUV accident statistics by the numbers
SUV accident statistics show a split story
SUVs continue to dominate American roads, but the latest crash data shows a more complicated safety picture than many drivers expect.
Fatality rates per registered SUV improved, yet total SUV occupant deaths and injuries remained high enough to make this one of the most closely watched segments in traffic safety.
Table of contents
- Key takeaways
- Overall SUV accident statistics
- SUV fatality and injury trends
- SUV crash types and rollover statistics
- Driver, passenger, and behavior data
- SUV vs. car crash compatibility statistics
- SUV driver death rates by size
- Pedestrian and cyclist statistics
- State-level SUV fatality statistics
Key takeaways
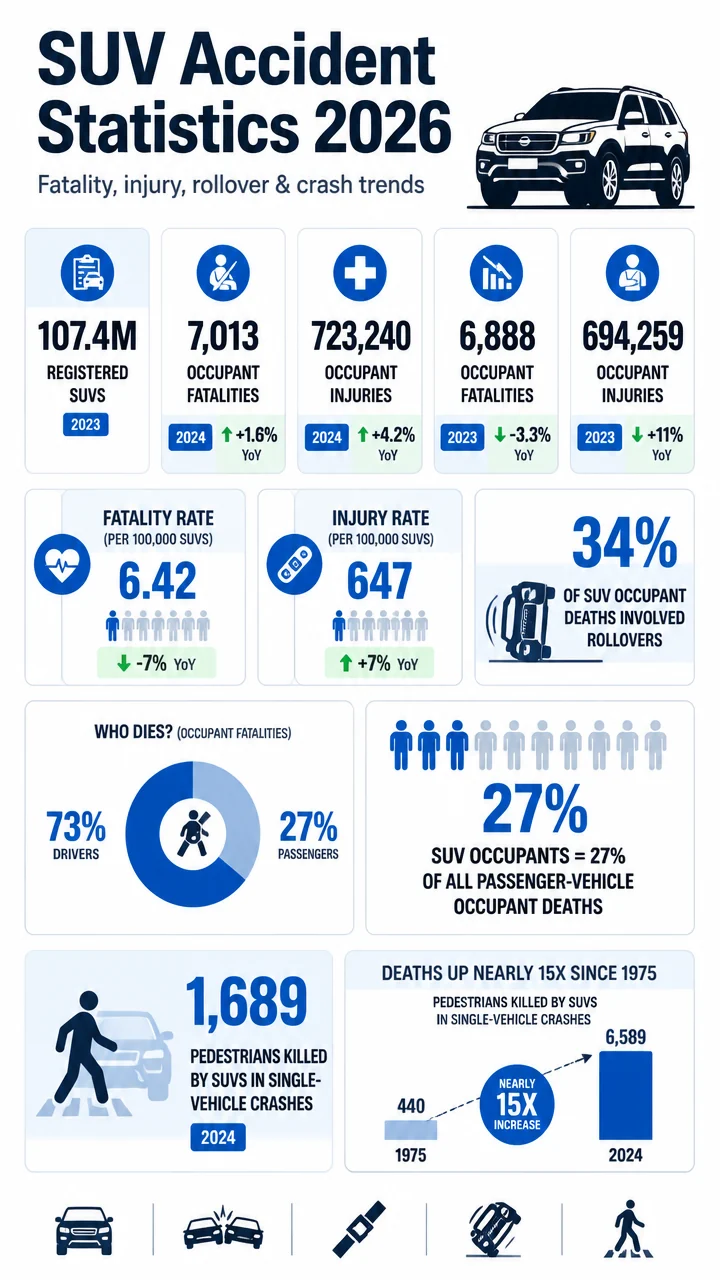
- 7,013 U.S.
SUV occupant fatalities were recorded in 2024, up 1.6% from 2023.
- 723,240 SUV occupants were injured in 2024, up 4.2% year over year.
- 6.42 deaths per 100,000 registered SUVs was the 2023 fatality rate, down 7% from 2022.
- 647 injuries per 100,000 registered SUVs was the 2023 injury rate, up 7% from 2022.
- 34% of U.S.
SUV occupant deaths in 2023 involved rollover crashes.
- 73% of SUV occupant deaths in 2023 were drivers, while 27% were passengers.
- 27% of all passenger vehicle occupant deaths in 2023 were SUV occupant deaths.
- 1,689 pedestrians were killed by SUVs in single-vehicle crashes in 2023.
Overall SUV accident statistics
SUV occupant fatalities reached 6,888 in 2023, according to NHTSA, down by 233 deaths or 3.3% from 7,121 in 2022.
That decline offered some relief, but it did not last.
Fatalities rose again to 7,013 in 2024, an increase of 112 deaths or 1.6% from 6,901 in 2023 in the 2024 FARS overview.
SUV occupant fatalities were also one of only two major U.S. traffic-fatality categories that increased in 2024, alongside older-driver crashes.
Injuries moved in the opposite direction of rates.
An estimated 694,259 SUV occupants were injured in traffic crashes in 2023, up 11% from 624,248 in 2022.
Then injuries climbed again to 723,240 in 2024, adding 28,952 more injuries or 4.2% year over year.
SUVs represented 27% of all passenger vehicle occupant deaths in 2023, with 6,589 of 24,238 deaths based on IIHS occupant data.
That means more than 1 in 4 passenger vehicle occupant deaths involved SUV occupants.
The long-term trend is striking: SUV occupant deaths have increased nearly 15-fold since 1975, when 440 SUV occupants died.
That surge reflects how much larger the SUV fleet has become over time.
| Metric | 2022 | 2023 | 2024 |
|---|---|---|---|
| SUV occupant fatalities | 7,121 | 6,888 | 7,013 |
| Year-over-year change | – | -3.3% | +1.6% |
| SUV occupant injuries | 624,248 | 694,259 | 723,240 |
| Injury change | – | +11.0% | +4.2% |
SUV fatality and injury trends
The 2023 SUV fatality rate was 6.42 deaths per 100,000 registered SUVs, down 7% from 6.93 in 2022.
That is a meaningful improvement on a per-vehicle basis.
The injury rate was less encouraging.
In 2023, the SUV occupant injury rate rose to 647 injured occupants per 100,000 registered SUVs, up 7% from 607 in 2022.
Registration growth helps explain the mixed picture.
There were 107,357,274 registered SUVs in the U.S. in 2023, up 4% from 102,758,301 in 2022.
More SUVs on the road can lower rates while still keeping total casualties elevated.
Exposure-based mileage data also shows SUVs outperforming passenger cars in fatality rate terms.
Within the light-truck category that includes SUVs, the occupant fatality rate was 0.66 per 100 million vehicle miles traveled in 2023.
Passenger car occupants posted a much higher rate of 1.13, nearly double the light-truck rate.
- 6.42 deaths per 100,000 registered SUVs in 2023
- 647 injuries per 100,000 registered SUVs in 2023
- 107.4 million registered SUVs in 2023
- 0.66 occupant fatalities per 100 million VMT for light trucks in 2023
- 1.13 occupant fatalities per 100 million VMT for passenger cars in 2023
SUV crash types and rollover statistics
Single-vehicle crashes caused 45% of SUV occupant deaths in 2023, totaling 2,997 deaths.
The remaining 55%, or 3,592 deaths, happened in multiple-vehicle crashes.
Frontal impacts dominated SUV fatal crashes.
In 2023, 60% of SUV occupant deaths came from frontal impacts, totaling 3,932 deaths.
Side impacts accounted for 20% or 1,323 deaths, rear impacts for 5% or 326 deaths, and other impacts including rollover for 15% or 1,008 deaths.
Rollover remains one of the defining SUV crash risks.
IIHS data shows rollover crashes accounted for 34% of SUV occupant deaths in 2023, while NHTSA puts the share at 33%.
Either way, roughly one-third of SUV occupant deaths involved a rollover.
Single-vehicle rollover crashes alone made up 24% of all SUV occupant deaths in 2023.
IIHS counted 2,266 SUV occupant deaths in rollover crashes that year, while NHTSA recorded 2,307 rollover occupant fatalities, down 11% from 2,595 in 2022.
That decline continues a multi-year improvement.
SUV rollover occupant fatalities fell from 2,579 in 2021 to 2,307 in 2023, a 10.5% decline over two years.
The rollover fatality rate was 2.15 deaths per 100,000 registered SUVs in 2023, down 15% from 2.53 in 2022.
Rural roads are much more rollover-prone than urban roads.
Among SUVs involved in rural fatal crashes in 2023, 27% experienced a rollover.
Among SUVs involved in urban fatal crashes, only 11% rolled over.
Pre-rollover crash dynamics matter too.
In SUV rollover crashes, 45% of deaths involved a frontal pre-rollover impact, while 25% had no prior impact before the rollover.
| SUV crash pattern | 2023 figure |
|---|---|
| Single-vehicle share of SUV occupant deaths | 45% (2,997) |
| Multiple-vehicle share of SUV occupant deaths | 55% (3,592) |
| Frontal-impact share | 60% (3,932) |
| Side-impact share | 20% (1,323) |
| Rear-impact share | 5% (326) |
| Rollover share of SUV occupant deaths | 33% to 34% |
| Rollover occupant deaths | 2,266 to 2,307 |
| Rural fatal-crash rollover involvement | 27% |
| Urban fatal-crash rollover involvement | 11% |
Driver, passenger, and behavior data
Drivers made up nearly three-quarters of SUV occupant deaths.
In 2023, 4,779 SUV drivers died compared with 1,806 passengers.
That works out to 73% drivers and 27% passengers.
Alcohol impairment was a major factor in fatal SUV crashes.
Nineteen percent of SUV drivers involved in fatal 2023 crashes were alcohol-impaired at a BAC of 0.08 g/dL or higher.
In raw numbers, 2,634 alcohol-impaired SUV drivers were involved in fatal crashes.
Speeding also remained a significant issue.
Fourteen percent of SUV drivers involved in fatal 2023 crashes were reported as speeding, totaling 2,009 drivers.
Seat belt use changes sharply between day and night.
Among daytime fatal crashes in 2023, 39% of killed SUV occupants were unrestrained, which was the lowest unrestrained share of any passenger vehicle type.
At night, the unrestrained share rose to 54%.
Ejection data shows why restraint use matters.
In fatal 2023 crashes, 20% of killed light-truck occupants, including SUV occupants, were totally ejected, compared with 13% of killed passenger car occupants.
Across passenger vehicles, 82% of occupants who were totally ejected were killed.
- 19% of SUV drivers in fatal crashes were alcohol-impaired
- 2,634 alcohol-impaired SUV drivers were involved in fatal crashes
- 14% of SUV drivers in fatal crashes were speeding
- 2,009 speeding SUV drivers were involved in fatal crashes
- 39% of killed SUV occupants in daytime fatal crashes were unrestrained
- 54% of killed SUV occupants in nighttime fatal crashes were unrestrained
SUV vs. car crash compatibility statistics
When cars and light trucks collide, car occupants face the greater fatality risk.
In fatal two-vehicle car-versus-light-truck crashes in 2023, occupants were 2.8 times more likely to die in the passenger car than in the light truck.
The imbalance was even worse in head-on crashes.
In 2023 head-on fatal crashes between a passenger car and light truck, car occupants were 2.9 times more likely to die than light-truck occupants.
Side impacts were the starkest mismatch.
When a light-truck front hit a passenger car side in 2023 fatal crashes, car occupants were 14.4 times more likely to die than light-truck occupants.
These crashes are not rare.
There were 3,655 fatal two-vehicle crashes involving one passenger car and one light truck in 2023.
These represented 26% of all fatal two-vehicle crashes and 10% of all fatal traffic crashes.
Newer research suggests heavy SUVs have become less dangerous to crash partners than they used to be.
SUVs over 5,000 pounds killed car crash partners at 1.9 times the car rate in 2011-2016, but only 1.2 times the car rate in 2017-2022.
That is a meaningful compatibility improvement.
In 2011-2016, car occupants were 90% more likely to die in crashes with SUVs over 5,000 pounds than in crashes with other cars.
Between 2017 and 2022, those heavy SUVs were only 20% more likely than cars to result in car-partner fatalities.
Pickups remain more harmful to car occupants than SUVs.
Pickup trucks killed car crash partners at 2.5 times the car rate in 2011-2016 and 1.9 times in 2017-2022.
Weight still creates tradeoffs.
For cars below average weight, every additional 500 pounds reduced driver death rate by 17 per million registered vehicle years while increasing crash-partner car deaths by 1.
| Crash compatibility measure | Figure |
|---|---|
| Car occupant death likelihood vs. light-truck occupant in fatal car-vs-light-truck crashes | 2.8x higher |
| Car occupant death likelihood in head-on car-vs-light-truck fatal crashes | 2.9x higher |
| Car occupant death likelihood when light-truck front hits car side | 14.4x higher |
| Fatal car-plus-light-truck crashes in 2023 | 3,655 |
| Heavy SUV crash-partner death rate vs. cars, 2011-2016 | 1.9x |
| Heavy SUV crash-partner death rate vs. cars, 2017-2022 | 1.2x |
SUV driver death rates by size
For newer vehicles, SUVs posted the lowest single-vehicle driver death rate of any passenger vehicle type.
Among 1-to-3-year-old vehicles in 2023, SUVs had 11 driver deaths per million registered vehicle years in single-vehicle crashes.
In multiple-vehicle crashes, the SUV driver death rate was 18 per million.
Overall, the SUV driver death rate for 1-to-3-year-old vehicles was 29 deaths per million registered vehicle years.
Small SUVs had the highest death rate among SUV size classes.
Small SUVs recorded 39 driver deaths per million for 1-to-3-year-old registered vehicle years in 2023.
Midsize SUVs recorded 23, and large SUVs recorded 18.
Rollover shares differ by size and drivetrain.
Single-vehicle rollover deaths accounted for 26% of all SUV driver deaths in 2023.
Midsize SUVs had the highest single-vehicle rollover share of driver deaths at 28%, while large SUVs reached 36%.
Four-wheel-drive SUVs had 33% of driver deaths in single-vehicle rollovers versus 24% for two-wheel-drive SUVs.
| SUV segment or metric | 2023 driver death rate / share |
|---|---|
| Single-vehicle crash driver death rate | 11 per million |
| Multiple-vehicle crash driver death rate | 18 per million |
| Overall SUV driver death rate | 29 per million |
| Small SUV driver death rate | 39 per million |
| Midsize SUV driver death rate | 23 per million |
| Large SUV driver death rate | 18 per million |
| Single-vehicle rollover share of SUV driver deaths | 26% |
| Midsize SUV rollover share | 28% |
| Large SUV rollover share | 36% |
| 4WD SUV rollover share | 33% |
| 2WD SUV rollover share | 24% |
Pedestrian and cyclist statistics
SUV crash risks extend beyond occupants.
In 2023, SUVs struck and killed 1,689 pedestrians in single-vehicle crashes.
That gave SUVs the majority share of light-truck pedestrian deaths.
SUVs accounted for 56.0% of U.S. light-truck pedestrian deaths in single-vehicle crashes, with 1,689 of 3,016 deaths.
Most of those fatal pedestrian impacts involved the SUV front end.
In single-vehicle pedestrian crashes in 2023, 91.8% of pedestrians killed by SUVs were struck by the front of the vehicle.
Pedalcyclist deaths were lower in volume but showed a similar pattern.
SUVs struck and killed 247 pedalcyclists in single-vehicle crashes in 2023, and 85.8% were killed by front impact.
Light trucks were involved in a large share of fatal cyclist crashes.
Light trucks including SUVs were involved in 557 of 1,091 U.S. single-vehicle fatal pedalcyclist crashes where the first harmful event was a collision with the cyclist in 2023.
State-level SUV fatality statistics
Hawaii had the highest state share of SUV fatalities in 2023.
In Hawaii, 47% of passenger vehicle occupant deaths were SUV occupant deaths.
Alaska and New Hampshire tied for the next-highest share, with SUVs accounting for 39% of passenger vehicle occupant deaths in each state.
Large states posted substantial raw totals.
California recorded 495 SUV occupant deaths in 2023, the highest count in the supplied state figures, and those deaths represented 23% of the state’s passenger vehicle occupant fatalities.
Florida followed closely with 471 SUV occupant deaths, making up 30% of the state’s passenger vehicle occupant fatalities.
Texas recorded 293 SUV occupant deaths, accounting for 29% of the state’s passenger vehicle occupant fatalities.
| State | SUV occupant deaths or share | Context |
|---|---|---|
| Hawaii | 47% | Highest share of passenger vehicle occupant deaths |
| Alaska | 39% | Tied for second-highest share |
| New Hampshire | 39% | Tied for second-highest share |
| California | 495 deaths | 23% of passenger vehicle occupant fatalities |
| Florida | 471 deaths | 30% of passenger vehicle occupant fatalities |
| Texas | 293 deaths | 29% of passenger vehicle occupant fatalities |
SUV accident statistics by the numbers
- 7,013 SUV occupant fatalities in 2024
- 723,240 SUV occupant injuries in 2024
- 27% of all passenger vehicle occupant deaths were SUV occupants in 2023
- 34% of SUV occupant deaths involved rollovers
- 60% of SUV occupant deaths came from frontal impacts
- 19% of SUV drivers in fatal crashes were alcohol-impaired
- 14% of SUV drivers in fatal crashes were speeding
- 1,689 pedestrians were killed by SUVs in single-vehicle crashes
- 247 pedalcyclists were killed by SUVs in single-vehicle crashes
- 39 driver deaths per million was the small-SUV rate, versus 18 for large SUVs