Table of Contents
- Off-road SUV statistics: quick reality check
- Table of contents
- Off-road SUV market size and growth statistics
- U.S. off-road SUV sales and market share statistics
- Regional off-road SUV and 4×4 market statistics
- Best-selling off-road SUV model statistics
- Off-road SUV usage and buyer behavior statistics
- Overlanding and expedition market statistics
- Off-road SUV aftermarket and accessories statistics
- Off-road SUV demographics and audience statistics
Off-road SUV statistics: quick reality check
The off-road SUV story is bigger than rugged styling and trail-ready badges: it is now a massive global market with strong growth, rising overlanding demand, and a surprisingly large gap between image and actual off-road use.
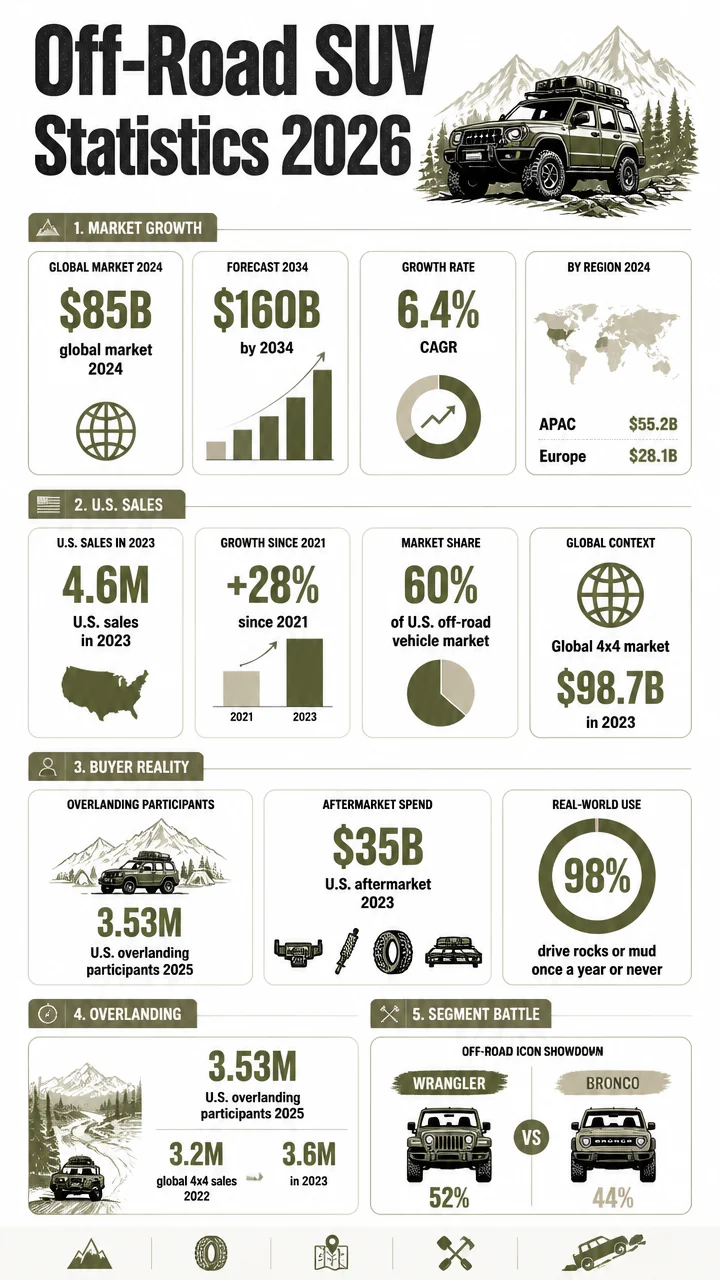
The biggest contradiction in the category may be this: while the global off-road SUV market was valued at $85 billion in 2024 and is projected to reach $160 billion by 2034, 98% of SUV and crossover buyers drive over rocks or mud at most once per year, if ever.
- $85 billion: estimated global off-road SUV market value in 2024.
- $160 billion: projected global off-road SUV market by 2034.
- 4.6 million: U.S. off-road SUV sales reached this level in 2023 after 28% growth from 2021.
- 60%: share of the 2023 U.S. off-road vehicle market held by off-road SUVs.
- 3.53 million: estimated U.S. overlanding participants in 2025.
- 35 billion: value of the U.S. off-road vehicle aftermarket in 2023.
- 52% vs.
44%:
Jeep Wrangler and Ford Bronco shares of the U.S. midsize off-road SUV segment in Q4 2024.
Table of contents
- Off-road SUV market size and growth statistics
- U.S. off-road SUV sales and market share statistics
- Regional off-road SUV and 4×4 market statistics
- Best-selling off-road SUV model statistics
- Off-road SUV usage and buyer behavior statistics
- Overlanding and expedition market statistics
- Off-road SUV aftermarket and accessories statistics
- Off-road SUV demographics and audience statistics
Off-road SUV market size and growth statistics
The global off-road SUV market was worth an estimated $85 billion in 2024, according to Exactitude Consultancy data cited by Dealership Guy.
That alone puts the niche into mainstream automotive scale.
By 2034, the off-road SUV market is projected to hit $160 billion, implying a 6.4% compound annual growth rate.
That is a notable long-run growth profile for a segment often treated as lifestyle-driven rather than structurally important.
$160 billion is the recurring upside figure attached to both off-road SUV and broader off-road 4×4 forecasts, signaling how large the adventure-focused vehicle economy could become over the next decade.
The broader market data reinforces the trend.
The global off-road 4×4 market was valued at $98.7 billion in 2023 and is projected to grow at a 7.1% CAGR from 2024 to 2032.
A separate forecast puts the same market at $160 billion by 2032 at a 7.2% CAGR.
Even when looking at a wider off-road vehicle category rather than SUV-specific or 4×4-focused data, the market remains substantial.
The global off-road vehicles market was valued at $25.44 billion in 2025 and is expected to reach $39.01 billion by 2035 at a 4.37% CAGR.
- Off-road SUVs alone represent an $85 billion market today.
- Long-term forecasts repeatedly point toward roughly $160 billion in future market size.
- Broader off-road 4×4 growth rates of 7.1% to 7.2% suggest momentum stronger than many mature auto segments.
- Even conservative broader-category forecasts still show steady expansion through 2035.
| Market | Base Value | Forecast Value | Growth Rate |
|---|---|---|---|
| Global off-road SUV market | $85B in 2024 | $160B by 2034 | 6.4% CAGR |
| Global off-road 4×4 market | $98.7B in 2023 | $160B by 2032 | 7.1%-7.2% CAGR |
| Global off-road vehicles market | $25.44B in 2025 | $39.01B by 2035 | 4.37% CAGR |
| Global overland expedition vehicle market | $4.27B in 2024 | $8.98B by 2033 | 8.6% CAGR |
Off-road SUVs accounted for 60% of the U.S. off-road vehicle market in 2023, while pickup trucks made up 38.7%.
That gives SUVs a clear edge in the American off-road market mix.
U.S. off-road SUV sales climbed 28% from 2021 to 2023, reaching 4.6 million units.
For a supposedly specialized segment, that is a very large sales base.
The broader U.S. off-road-specific vehicle category also accelerated.
Sales reached 1.2 million units in 2022, up 18% from 2021, and then rose again to 1.4 million units in 2023, a further 16.7% increase from 2022.
Registered off-road vehicles in the U.S. reached 14.5 million in 2023, up 22% from 2019.
At the same time, off-road recreation participants increased from 30 million in 2019 to 35 million in 2023.
The combination of 4.6 million U.S. off-road SUV sales, 1.4 million off-road-specific vehicle sales, and 14.5 million registered off-road vehicles suggests this is not just an enthusiast niche.
It is a large consumer market with recurring replacement, upgrade, and accessory demand.
There is also a wider tailwind from the overall American vehicle mix.
62% of new U.S. vehicles sold in model year 2023 were trucks under EPA regulations, a category that includes SUVs, pickups, and vans.
That structural shift helps explain why rugged SUV nameplates continue to attract attention.
Regional off-road SUV and 4×4 market statistics
Asia-Pacific is the largest regional growth story in the dataset. The region’s off-road 4×4 vehicle market was valued at $55.2 billion in 2023 and is growing at a 5.5% CAGR through 2030.
Europe’s off-road 4×4 market was valued at $28.1 billion in 2022 with a projected 4.8% CAGR.
That is slower than some global growth forecasts, but still points to steady expansion.
North America held a 66% share of the global off-road vehicles market in 2025, showing how dominant the region remains in the broader category.
In the Middle East, the off-road vehicle market is valued at approximately $4.0 billion in 2024.
This may be smaller than Asia-Pacific or Europe in absolute terms, but its demand fundamentals stand out: off-road recreational participation increased 30% from 2020 to 2023, and the region attracts over 10 million adventure tourists annually.
| Region | Market Value | Growth / Share | Notable Insight |
|---|---|---|---|
| Asia-Pacific | $55.2B in 2023 | 5.5% CAGR through 2030 | Largest regional value in dataset |
| Europe | $28.1B in 2022 | 4.8% CAGR | Steady but slower growth profile |
| North America | N/A | 66% global share in 2025 | Dominant global market share |
| Middle East | $4.0B in 2024 | 30% participation growth from 2020-2023 | Boosted by 10M+ adventure tourists annually |
One nuance matters here: in the broader North American off-road 4×4 market, pickup trucks held a 65% share in 2023, while SUVs accounted for 35%.
That contrasts with the U.S.-specific off-road vehicle mix, where SUVs led at 60%.
The takeaway is that regional definitions and segment framing can materially change the split.
Best-selling off-road SUV model statistics
Jeep Wrangler and Ford Bronco are the headline rivalry in the U.S. off-road SUV segment. In Q4 2024, the midsize off-road SUV segment totaled 73,274 units, with the Wrangler at 52%, the Bronco at 44%, and the Toyota 4Runner at 4%.
Jeep sold 151,163 Wrangler units in the U.S. in 2024, down 3% from 156,581 in 2023.
Then it rebounded sharply in 2025 to 167,322 units, an 11% year-over-year increase.
The electrified version is now central to the Wrangler story.
The Wrangler 4xe made up 55,554 units in 2024, or 37% of total Wrangler sales, and it was America’s best-selling plug-in hybrid vehicle in 2024.
More than 1 in 3 Wranglers sold in 2024 was a 4xe plug-in hybrid.
Ford sold 109,172 Bronco units in 2024, up 3.3% from 2023, then surged to 146,007 units in 2025, a 33.7% jump.
Bronco also posted a strong quarter-end sprint, with 32,224 units sold in Q4 2024, up 127% from 14,197 a year earlier.
Toyota’s off-road SUV lineup showed mixed momentum. The 4Runner sold 92,156 units in 2024, down 22.7% from 119,238 in 2023, before recovering to 98,804 units in 2025.
The returning Land Cruiser posted 29,113 units in 2024 and then jumped to 43,946 units in 2025, up 50.95%.
| Model | 2024 U.S. Sales | 2025 U.S. Sales | Latest Growth Signal |
|---|---|---|---|
| Jeep Wrangler | 151,163 | 167,322 | +11% in 2025 |
| Ford Bronco | 109,172 | 146,007 | +33.7% in 2025 |
| Toyota 4Runner | 92,156 | 98,804 | Recovered after -22.7% in 2024 |
| Toyota Land Cruiser | 29,113 | 43,946 | +50.95% in 2025 |
For historical context, Wrangler peaked at 240,032 U.S. sales in 2018, while Bronco peaked at 117,057 in 2022, its first full calendar year.
The current race shows both models still operating at scale, but neither is at its absolute historical high.
Brand-wide context is also useful.
Jeep’s total U.S. sales were 593,401 units in 2025, up 1% from 2024, but the brand’s U.S. market share was only 3.62% in 2025 versus a peak of 5.58% in 1999.
Jeep also sold more than 973,000 SUVs in the U.S. at its 2018 peak before sliding to under 590,000 by 2025.
Off-road SUV usage and buyer behavior statistics
This is where the data gets most surprising. Despite the scale of the category, 98% of SUV and crossover buyers drive off-road over rocks or mud at most once per year or never.
Similarly, 91% drive on dirt or gravel once per year or not at all.
That means off-road capability often functions as a purchase signal even when it is rarely used.
Buyers appear to value the option of capability more than frequent trail behavior.
- 10% to 15% of Jeep Wrangler customers take their vehicles off-road.
- 18% of Ford Expedition customers take their vehicles off-road.
- 12% of Ford Explorer customers take their vehicles off-road.
- Nearly 20% of all off-roading is claimed by Toyota vehicles.
The recreational side is still very real among owners.
80% of off-road vehicle owners use their vehicle for recreational purposes at least once a month.
In the U.S., the average registered off-road vehicle logged 12 trips in 2023, with an average distance of 50 miles per trip.
65% of consumers use financing when purchasing a new off-road vehicle, which matters for pricing and affordability analysis.
It also helps explain how premium trims and accessories remain viable even as average prices rise.
For example, Jeep’s average transaction price was $53,516 in Q1 2023.
Overlanding and expedition market statistics
Overlanding is one of the clearest growth narratives within off-road SUV statistics. The global overland expedition vehicle market reached $4.27 billion in 2024 and is projected to hit $8.98 billion by 2033, expanding at an 8.6% CAGR.
SUVs dominate the overland expedition vehicle segment because they combine comfort and trail capability, according to DataIntelo.
That positioning aligns perfectly with how the modern off-road SUV is marketed: adventure-ready, but livable day to day.
In the U.S., the overlanding market is estimated at 3.53 million participants in 2025.
That total includes 1.53 million vehicle owners and 2.0 million passengers.
U.S. overlanding participation is growing at an estimated 19% annual rate, making it one of the fastest-expanding use cases in the broader category.
Overlanding helps explain why buyers keep paying for roof racks, all-terrain tires, extra cargo systems, and trail-focused trims even if extreme rock-crawling remains uncommon.
There is adjacent growth in expedition trucks too.
The expedition truck market is valued at $260.0 million in 2025 and is projected to reach $456.8 million by 2035 at a 5.8% CAGR.
Within that segment, the 3.5-7.5 tonne class held 46.2% market share in 2025.
Off-road SUV aftermarket and accessories statistics
The aftermarket is one of the strongest monetization layers in off-road SUV culture. The U.S. off-road vehicle aftermarket was valued at $35 billion in 2023, representing 35% of the global total.
Globally, the off-road vehicle aftermarket is expected to reach $52.3 billion by 2027 at a 5.8% CAGR.
That indicates accessory spending is growing alongside vehicle demand.
The most popular accessory category is highly visible: lift kits accounted for 35% of 2023 aftermarket sales.
That says a lot about buyer priorities, especially the value of stance, clearance, and visual ruggedness.
25% of new 4×4 purchases in the U.S. included aftermarket accessories in 2023, up from 22% in 2022.
In other words, one in four new 4×4 purchases already includes add-on spending early in ownership.
- $35B U.S. aftermarket value shows how much spending happens after the vehicle sale.
- Lift kits at 35% lead accessory demand.
- 25% of new U.S.
4×4 purchases include accessories, up from 22%.
- Accessory demand is supported by both recreational users and style-driven buyers.
Off-road SUV demographics and audience statistics
The off-road audience remains male-skewed, but the ownership base is broadening. A 2023 industry survey found 65% of U.S. off-road 4×4 owners are male and 30% are female.
Another audience estimate put the U.S. off-road vehicle audience at 10,308,964 people, with 74.1% male and an average age of 38.2.
Female ownership of off-road vehicles has increased 15% since 2018, suggesting the segment is gradually becoming less narrowly defined than its stereotype.
| Demographic Metric | Figure |
|---|---|
| Male share of U.S. off-road 4×4 owners | 65% |
| Female share of U.S. off-road 4×4 owners | 30% |
| Age 18-34 | 22% |
| Age 35-54 | 55% |
| Age 55+ | 23% |
| Estimated U.S. audience size | 10,308,964 |
| Average audience age | 38.2 |
The age profile is especially useful for marketers.
22% of owners are 18-34, 55% are 35-54, and 23% are 55+.
That makes the core audience firmly middle-aged rather than primarily Gen Z or retiree-led.
Geographically, the biggest audience concentrations are in the largest Sun Belt and coastal markets.
California leads with 1,242,169 people, followed by Texas at 970,805 and Florida at 612,734.
| Top U.S. States by Off-Road Vehicle Audience | Audience |
|---|---|
| California | 1,242,169 |
| Texas | 970,805 |
| Florida | 612,734 |
The clearest demographic summary is this: off-road SUVs are powered by a large, mostly male but expanding ownership base, centered on ages 35 to 54, with especially strong audience density in California, Texas, and Florida.