Table of Contents
- Midsize SUV statistics: the segment now sets the pace
- Table of contents
- Key takeaways
- Midsize SUV market share statistics
- Global midsize SUV market size and growth statistics
- Midsize SUV pricing and transaction price statistics
- U.S. midsize SUV sales statistics
- Top-selling midsize SUV models and fastest movers
- Midsize SUVs in broader SUV rankings
- Monthly and quarterly midsize SUV sales trends
- Midsize SUV benchmarks: towing, cargo, mpg, and power statistics
Midsize SUV statistics: the segment now sets the pace
Midsize SUVs have moved from a strong niche to the center of the U.S. auto market, and the latest numbers show the category gaining share, outselling rivals, and commanding far higher prices than compact SUVs.
From U.S. market leadership in late 2025 to a global market projected to top $1 trillion by 2035, these midsize SUV statistics highlight just how large and influential the segment has become.
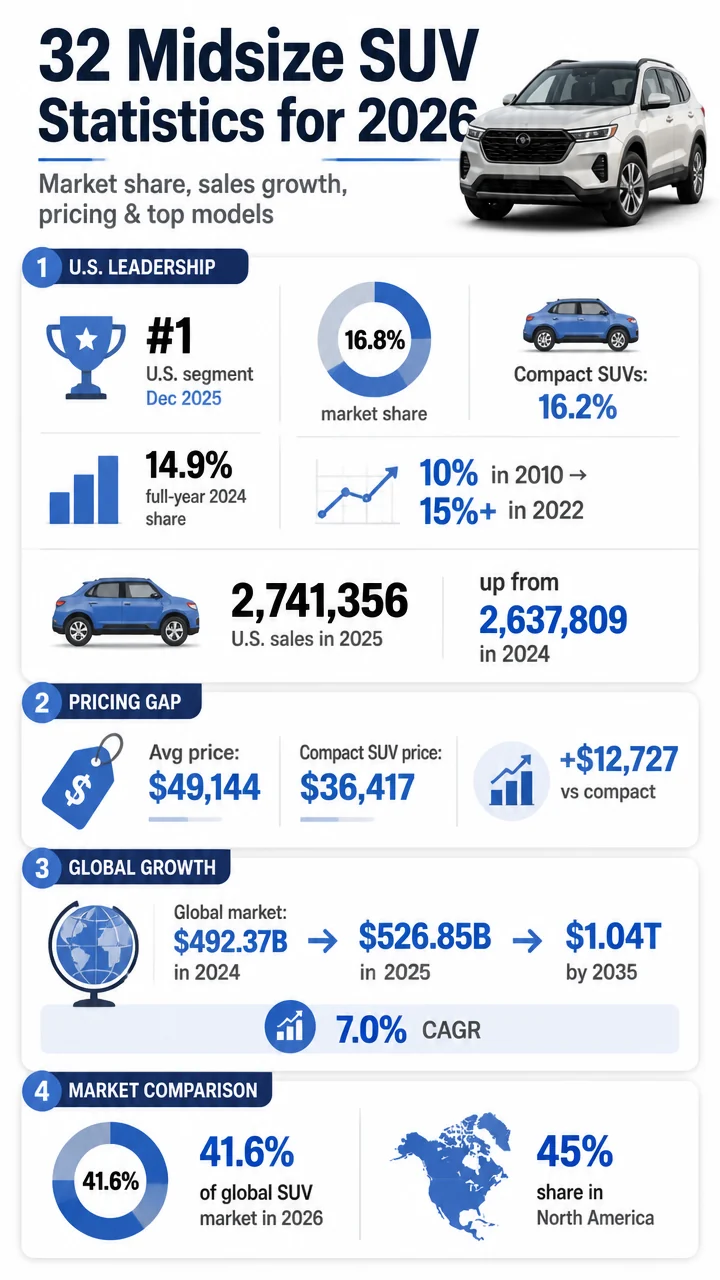
Big number: Midsize SUVs captured 16.8% of the U.S. vehicle market in December 2025, making them the best-selling vehicle segment in the country.
Table of contents
- Key takeaways
- Midsize SUV market share statistics
- Global midsize SUV market size and growth statistics
- Midsize SUV pricing and transaction price statistics
- U.S. midsize SUV sales statistics
- Top-selling midsize SUV models and fastest movers
- Monthly and quarterly midsize SUV sales trends
- Midsize SUV benchmarks: towing, cargo, mpg, and power
Key takeaways
At a glance
- Over 15% of all U.S. new vehicle sales in 2022 came from midsize SUVs, up from 10% in 2010.
- 14.9% was the full-year 2024 U.S. market share for the midsize non-premium SUV segment.
- 16.8% was the segment’s market share in December 2025, topping compact SUVs at 16.2%.
- $49,144 was the average transaction price for a U.S. midsize SUV in December 2025.
- 2,741,356 tracked U.S. midsize SUV sales were recorded in 2025, up from 2,637,809 in 2024.
- $492.37 billion was the estimated global mid-size SUV market in 2024.
- $1,036.59 billion is the projected global market size by 2035.
- 41.60% of the global SUV market is projected to belong to mid-sized SUVs in 2026.
Midsize SUVs have gained at least 5 percentage points of U.S. sales share since 2010. The segment accounted for over 15% of all U.S. new vehicle sales in 2022, up from just 10% in 2010.
That is a major long-term shift in consumer preference toward larger, family-oriented utility vehicles.
The category remained huge in 2024. The midsize non-premium SUV segment held 14.9% of the U.S. market for the full year 2024, according to GlobalData and S&P Global Mobility.
By December 2025, midsize SUVs were the top vehicle segment in America. Kelley Blue Book and Cox Automotive reported a 16.8% market share for the segment in December 2025.
That lead mattered because compact SUVs trailed for the first time in 2025. Compact SUVs captured 16.2% market share in December 2025, leaving midsize SUVs ahead by 0.6 percentage points.
Why it matters: The market-share gap between midsize and compact SUVs was not huge, but the symbolic shift is important.
A segment once viewed as a step up now appears to be the default choice for a large share of U.S. buyers.
| U.S. market share stat | Figure |
|---|---|
| Midsize SUV share of U.S. new vehicle sales, 2010 | 10% |
| Midsize SUV share of U.S. new vehicle sales, 2022 | Over 15% |
| Midsize non-premium SUV share, full-year 2024 | 14.9% |
| Midsize SUV share, December 2025 | 16.8% |
| Compact SUV share, December 2025 | 16.2% |
Global midsize SUV market size and growth statistics
The global mid-size SUV market was worth nearly half a trillion dollars in 2024. Market Research Future estimated the category at $492.37 billion in 2024.
That number is expected to climb quickly. The same source projects the market will reach $526.85 billion in 2025 and $1,036.59 billion by 2035.
The long-run forecast points to steady expansion rather than a one-year spike. The expected compound annual growth rate is 7.0% from 2025 to 2035.
North America is the dominant regional player. It accounts for approximately 45% of the global mid-size SUV market share.
Within the wider SUV universe, midsize is expected to remain the leading format. Fortune Business Insights projects mid-sized SUVs will hold 41.60% of the global SUV market share in 2026.
The size gap versus compact SUVs is already striking in value terms. One projection in the dataset puts the mid-size SUV sales segment at $392.37 billion compared with $100.0 billion for the compact SUV segment.
Pull quote: “Mid-sized SUVs are projected to hold 41.60% of the global SUV market share in 2026.”
| Global midsize SUV metric | Figure |
|---|---|
| Global market size, 2024 | $492.37B |
| Projected market size, 2025 | $526.85B |
| Projected market size, 2035 | $1,036.59B |
| Forecast CAGR, 2025–2035 | 7.0% |
| North America share of global market | ~45% |
| Projected global SUV market share in 2026 | 41.60% |
| Projected mid-size SUV segment value | $392.37B |
| Projected compact SUV segment value | $100.0B |
Midsize SUV pricing and transaction price statistics
Midsize SUVs are not just popular; they are expensive. The average transaction price for a U.S. midsize SUV was $49,144 in December 2025.
Compact SUVs sold for far less. Their average transaction price was $36,417 in December 2025, meaning the midsize category carried a premium of $12,727.
Prices were already elevated in 2024. Kelley Blue Book ATP data showed mid-size SUV/crossover average transaction prices of $48,782 in April 2024 and $48,402 in August 2024.
That consistency suggests demand has supported pricing power. Even with modest month-to-month movement, transaction prices remained close to the upper-$48,000 range before moving above $49,000 by December 2025.
Fast facts
- $49,144 average U.S. midsize SUV transaction price in December 2025
- $36,417 average U.S. compact SUV transaction price in December 2025
- $12,727 higher average price for midsize versus compact SUVs
- $48,782 average midsize SUV/crossover transaction price in April 2024
- $48,402 average midsize SUV/crossover transaction price in August 2024
U.S. midsize SUV sales statistics
Tracked U.S. midsize SUV model sales rose to 2,741,356 units in 2025. That was up from 2,637,809 units in 2024, an increase of 103,547 vehicles.
December also showed strong momentum. Segment sales reached 261,606 units in December 2025 versus 228,361 in December 2024.
Those figures reinforce the market-share story: midsize SUVs are not merely holding their position; they are still adding meaningful volume.
Big number: 261,606 midsize SUVs were sold in the U.S. in December 2025 alone.
Top-selling midsize SUV models and fastest movers
The Ford Explorer led the U.S. midsize SUV field in 2025 with 222,706 sales. That was up 7.60% from 206,981 in 2024.
Jeep Grand Cherokee ranked second among the models listed, with 208,318 units. Unlike several rivals, it slipped 3.62% from 216,148 in 2024.
Several nameplates posted especially sharp growth. Nissan Murano surged 118.93%, Honda Passport rose 69.80%, Buick Enclave gained 49.59%, Chevrolet Traverse jumped 38.92%, and Dodge Durango climbed 35.65%.
There were also notable declines. Toyota Highlander fell 37.31%, Honda Pilot dropped 12.06%, Subaru Outback decreased 6.55%, Jeep Grand Cherokee slipped 3.62%, and Ford Bronco Sport edged down 2.65%.
| Model | 2025 U.S. sales | 2024 U.S. sales | YoY change |
|---|---|---|---|
| Ford Explorer | 222,706 | 206,981 | +7.60% |
| Jeep Grand Cherokee | 208,318 | 216,148 | -3.62% |
| Jeep Wrangler | 165,976 | 151,164 | +9.80% |
| Subaru Outback | 157,716 | 168,771 | -6.55% |
| Chevrolet Traverse | 147,022 | 105,835 | +38.92% |
| Ford Bronco | 146,007 | 120,074 | +21.60% |
| Hyundai Santa Fe | 142,404 | 113,343 | +25.64% |
| Ford Bronco Sport | 134,493 | 138,150 | -2.65% |
| Honda Pilot | 124,209 | 141,245 | -12.06% |
| Hyundai Palisade | 123,921 | 110,055 | +12.60% |
| Kia Telluride | 123,281 | 115,504 | +6.73% |
| Toyota 4Runner | 98,804 | 92,156 | +7.21% |
| Nissan Pathfinder | 93,950 | 74,556 | +26.01% |
| Dodge Durango | 80,521 | 59,358 | +35.65% |
| Toyota Highlander | 56,208 | 89,658 | -37.31% |
| Honda Passport | 55,231 | 32,527 | +69.80% |
| Nissan Murano | 42,291 | 19,317 | +118.93% |
| Buick Enclave | 39,488 | 26,398 | +49.59% |
Key takeaways from the model rankings
- Ford Explorer remained the volume leader.
- Jeep Grand Cherokee stayed near the top despite declining sales.
- Chevrolet Traverse, Hyundai Santa Fe, and Nissan Pathfinder were among the strongest mainstream gainers.
- Nissan Murano delivered the most dramatic percentage growth in the dataset.
- Toyota Highlander posted the steepest notable decline among established high-volume entries.
Midsize SUVs in broader SUV rankings
Midsize nameplates placed well in overall SUV popularity rankings, not just within their segment. In Kelley Blue Book’s 2025 tracking period, the Ford Explorer was the eighth best-selling SUV in the U.S. with 104,929 units.
The Jeep Grand Cherokee ranked ninth with 99,668 units, while the Honda Pilot ranked twenty-first with 65,194, Chevrolet Traverse ranked twenty-third with 64,779, and Kia Telluride ranked twenty-fourth with 61,502.
| Model | U.S. SUV rank | KBB tracked sales |
|---|---|---|
| Ford Explorer | 8th | 104,929 |
| Jeep Grand Cherokee | 9th | 99,668 |
| Honda Pilot | 21st | 65,194 |
| Chevrolet Traverse | 23rd | 64,779 |
| Kia Telluride | 24th | 61,502 |
Monthly and quarterly midsize SUV sales trends
The Ford Explorer closed 2025 with huge December momentum. It sold 23,887 units in December 2025 versus 15,851 in December 2024, a 50.70% increase.
The Toyota 4Runner had one of the most eye-catching monthly comparisons in the dataset. It recorded 11,132 U.S. sales in December 2025 versus just 60 in December 2024.
Early 2026 continued that strength for some leaders. The Ford Explorer sold 61,387 units in Q1 2026, up from 47,314 in Q1 2025.
The Toyota 4Runner also accelerated sharply into 2026. Q1 sales reached 33,244 units versus 8,435 in Q1 2025.
Fast facts
- 23,887 Ford Explorer sales in December 2025
- 50.70% Explorer December year-over-year increase
- 11,132 Toyota 4Runner sales in December 2025
- 61,387 Ford Explorer sales in Q1 2026
- 33,244 Toyota 4Runner sales in Q1 2026
Midsize SUV benchmarks: towing, cargo, mpg, and power statistics
Beyond sales, midsize SUV statistics also show why buyers gravitate to the segment: it blends family-friendly space, meaningful towing capacity, and relatively strong fuel economy for larger vehicles.
Power and towing benchmarks
- 2025 Ford Explorer 2.3L EcoBoost: 300 hp and 310 lb-ft of torque.
- 2025 Ford Explorer ST 3.0L EcoBoost V6: 400 hp and 415 lb-ft of torque.
- 2025 Honda Pilot: 285 hp and 262 lb-ft of torque.
- 2025 Toyota Highlander 2.4L turbo: 265 hp and 310 lb-ft of torque.
- 2025 Kia Telluride 3.8L V6: 291 hp and 262 lb-ft of torque.
- Ford Explorer towing capacity: 5,000 lbs on all trims with the standard Class III Trailer Tow Package.
- Honda Pilot maximum towing: 5,000 lbs when properly equipped.
- Toyota Highlander maximum towing: 5,000 lbs.
- Kia Telluride X-Pro AWD towing: 5,500 lbs, versus 5,000 lbs on other trims.
Cargo and interior space benchmarks
- Ford Explorer maximum cargo volume: 85.3 cu ft, or 85.8 cu ft on the Active trim.
- Ford Explorer cargo volume: 46.0 cu ft behind the second row and 16.3 cu ft behind the third row.
- Honda Pilot maximum cargo capacity: 87.0 cu ft with 18.6 cu ft behind the third row.
- Toyota Highlander maximum cargo volume: 84.3 cu ft with 16.0 cu ft behind the third row.
- Kia Telluride maximum cargo volume: 87.0 cu ft, with 46.0 cu ft behind the second row and 21.0 cu ft behind the third row.
- Honda Pilot third-row legroom: 32.5 inches versus 28.0 inches in the Toyota Highlander.
- Kia Telluride wheelbase: 114.2 inches; length: 196.9 inches; total interior volume: 178.1 cu ft.
- Honda Pilot wheelbase: 113.8 inches; overall length: 199.9 inches.
Fuel economy benchmarks
- Ford Explorer RWD 2.3L: 20 city / 29 highway / 24 combined mpg.
- Ford Explorer RWD 3.0L V6: 18 city / 25 highway / 21 combined mpg.
- Honda Pilot AWD: 19 city / 25 highway / 21 combined mpg.
- Toyota Highlander gas: 22 city / 29 highway / 25 combined mpg.
- Kia Telluride FWD: 20 city / 26 highway / 22 combined mpg.
- Kia Telluride AWD: 18 city / 23 highway / 20 combined mpg.
| Model | Horsepower | Towing capacity | Max cargo volume | Combined mpg |
|---|---|---|---|---|
| Ford Explorer 2.3L RWD | 300 hp | 5,000 lbs | 85.3 cu ft | 24 mpg |
| Ford Explorer ST 3.0L RWD | 400 hp | 5,000 lbs | 85.3 cu ft | 21 mpg |
| Honda Pilot AWD | 285 hp | 5,000 lbs | 87.0 cu ft | 21 mpg |
| Toyota Highlander gas | 265 hp | 5,000 lbs | 84.3 cu ft | 25 mpg |
| Kia Telluride FWD | 291 hp | 5,000 lbs | 87.0 cu ft | 22 mpg |
| Kia Telluride X-Pro AWD | 291 hp | 5,500 lbs | 87.0 cu ft | 20 mpg |
Pricing at the model level also shows the spread inside the segment. The 2025 Kia Telluride LX FWD starts at $36,390 excluding destination, while the Telluride SX-P X-Pro AWD reaches $53,685 excluding destination.
Safety remains a competitive baseline among leading family-focused midsize SUVs. Both the 2025 Honda Pilot and 2025 Toyota Highlander carry 5-star overall NHTSA safety ratings.