Table of Contents
- Crossover SUV statistics: the segment now defines the modern auto market
- Table of contents
- Crossover SUV market size and growth statistics
- Crossover SUV segment mix by drivetrain, fuel type, size, and use
- Regional crossover SUV statistics
- U.S. crossover SUV market share and sales statistics
- Best-selling crossover SUV models and rankings
- Electric and hybrid crossover SUV statistics
- Pricing, fuel economy, and efficiency benchmarks
- Industry structure and competitive crossover market data
Crossover SUV statistics: the segment now defines the modern auto market
Crossover SUVs are no longer just a fast-growing vehicle class—they are the center of gravity in the global car business.
The latest crossover SUV statistics show a market worth hundreds of billions, sales leadership across major regions, and a clear shift toward electrified, efficient, and high-volume crossover formats.
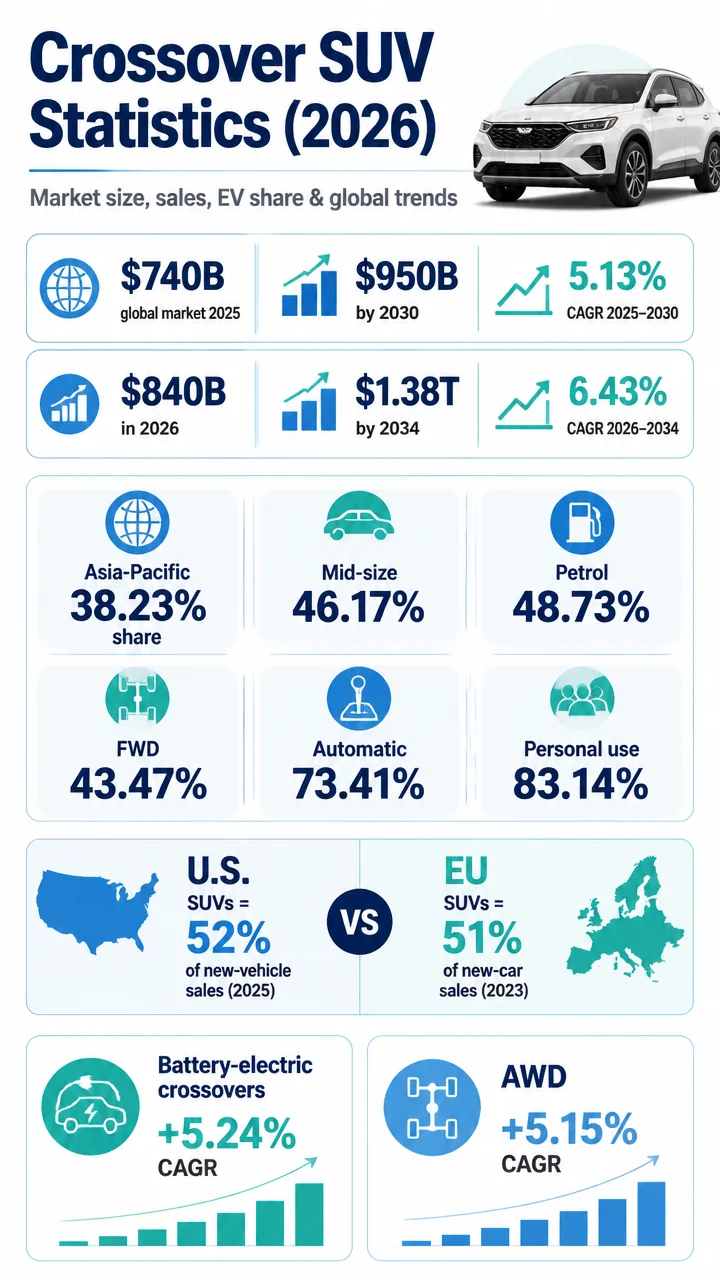
- USD 740 billion: estimated global crossover vehicles market in 2025.
- USD 950 billion: projected global crossover market by 2030.
- 38.23%: Asia-Pacific share of the global crossover market in 2024.
- 43.47%: front-wheel-drive share of the global crossover market in 2024.
- 48.73%: petrol crossover share globally in 2024.
- 46.17%: global share held by mid-size crossovers in 2024.
- 73.41%: automatic-transmission crossover share of global market volume in 2024.
- 83.14%: personal-use share of global crossover market volume in 2024.
- 52%: share of U.S. new-vehicle sales taken by SUVs in 2025.
- 51%: share of EU new-car sales represented by SUVs in 2023.
Table of contents
- Crossover SUV market size and growth statistics
- Crossover SUV segment mix by drivetrain, fuel type, size, and use
- Regional crossover SUV statistics
- U.S. crossover SUV market share and sales statistics
- Best-selling crossover SUV models and rankings
- Electric and hybrid crossover SUV statistics
- Pricing, fuel economy, and efficiency benchmarks
- Industry structure and competitive crossover market data
Crossover SUV market size and growth statistics
The global crossover vehicles market is estimated at USD 740 billion in 2025, according to Mordor Intelligence.
That alone puts crossover SUVs among the biggest revenue pools in the automotive industry.
By 2030, that market is projected to reach USD 950 billion, implying a 5.13% CAGR from 2025 to 2030.
In practical terms, the segment is not just large—it is still expanding at a pace that most mature auto categories would envy.
Another forecast points even higher.
Fortune Business Insights valued the global crossover vehicles market at USD 790 billion in 2025 and expects it to rise from USD 840 billion in 2026 to USD 1.38 trillion by 2034, with a 6.43% CAGR from 2026 to 2034.
USD 1.38 trillion is the upper-end long-range forecast for the crossover vehicles market by 2034, underscoring how central this body style has become to global automaker strategy.
| Market forecast source | 2025 market size | 2026 value | 2030 value | 2034 value | Forecast CAGR |
|---|---|---|---|---|---|
| Mordor Intelligence | USD 740B | — | USD 950B | — | 5.13% (2025–2030) |
| Fortune Business Insights | USD 790B | USD 840B | — | USD 1.38T | 6.43% (2026–2034) |
- The crossover SUV market is already approaching the trillion-dollar threshold.
- Both cited forecasts show durable mid-single-digit growth.
- The long-term outlook suggests the category will keep absorbing demand from traditional sedans and other body styles.
Crossover SUV segment mix by drivetrain, fuel type, size, and use
The most useful crossover SUV statistics are often the ones that reveal what buyers actually choose inside the segment.
The 2024 mix shows a category that is mainstream in configuration, but steadily opening to electrification and alternative usage models.
Front-wheel-drive crossovers held 43.47% of global market share in 2024, making FWD the largest drivetrain format in the category.
At the same time, all-wheel-drive crossovers are projected to grow at a 5.15% CAGR through 2030, pointing to strong demand for capability-oriented trims and premium positioning.
Petrol crossovers accounted for 48.73% of global market share in 2024, still the largest fuel type slice.
But battery-electric crossovers are forecast to grow at a 5.24% CAGR to 2030, indicating that EV adoption is becoming a structural growth driver inside the segment.
Mid-size crossovers captured 46.17% of global market share in 2024, making them the dominant size band.
Smaller formats are also gaining momentum, with small crossovers projected to expand at a 5.27% CAGR from 2025 to 2030.
Automatic-transmission crossovers represented 73.41% of global crossover market volume in 2024.
That stat highlights how automated drivetrains have become the standard expectation rather than a premium extra.
Personal-use crossovers made up 83.14% of global market volume in 2024, showing how deeply the segment is tied to household demand.
Still, fleet and subscription crossover applications are advancing at a 5.18% CAGR through 2030, and subscription and leasing programs accounted for about two-fifths of 2024 crossover fleet additions.
| Crossover segment metric | Statistic |
|---|---|
| Front-wheel-drive share, 2024 | 43.47% |
| All-wheel-drive CAGR to 2030 | 5.15% |
| Petrol share, 2024 | 48.73% |
| Battery-electric CAGR to 2030 | 5.24% |
| Mid-size crossover share, 2024 | 46.17% |
| Small crossover CAGR, 2025–2030 | 5.27% |
| Automatic transmission share, 2024 | 73.41% |
| Personal-use share, 2024 | 83.14% |
| Fleet/subscription CAGR to 2030 | 5.18% |
The crossover market is being shaped by a blend of mass-market familiarity and gradual reinvention: front-wheel drive, petrol, mid-size, and automatic still dominate, while AWD, BEVs, small crossovers, and subscription use cases provide the next growth layer.
Regional crossover SUV statistics
Asia-Pacific held 38.23% of the global crossover market in 2024, giving it the largest regional share in the dataset.
That makes APAC the single biggest center of demand for crossover vehicles today.
Growth leadership, however, is expected to come from outside the biggest incumbent market.
The Middle East and Africa is forecast to post the highest regional crossover CAGR at 5.21% through 2030.
Europe is also firmly in SUV territory.
SUVs accounted for 51% of total EU new-car sales in 2023, meaning more than half of the new-car market there was already SUV-led.
Within Europe, small crossover/SUV registrations reached 1,133,822 units in the first half of 2023, equal to 19.8% of all new cars sold.
Meanwhile, European compact crossover/SUV registrations reached 999,568 units in H1 2023.
- 38.23% of global crossover share came from Asia-Pacific in 2024.
- 5.21% is the highest regional CAGR forecast, belonging to the Middle East and Africa through 2030.
- 51% of EU new-car sales were SUVs in 2023.
- 1.13 million+ small crossover/SUV registrations were recorded in Europe in H1 2023 alone.
The U.S. market offers some of the clearest evidence that crossovers and SUVs have become the dominant consumer default.
SUVs accounted for 52% of U.S. new-vehicle sales in 2025, up sharply from 38% in 2016.
That 14-point increase over less than a decade shows how decisively utility vehicles have outgrown passenger cars in the U.S.
The shift did not happen overnight.
Utility vehicles reached 50% of U.S. light-vehicle sales in 2020, up from 48% in 2019, and IHS Markit had forecast they would climb to about 52% in 2021.
The 2025 result confirms that trajectory held.
Production data tells a similar story.
Car SUVs reached 12% of U.S. new-vehicle production share in model year 2023, while truck SUVs alone accounted for 50% of U.S. new-vehicle production in model year 2024.
Combined, car and truck SUVs represented 58% of all U.S. vehicles produced in model year 2023.
Inside the U.S. retail mix, compact crossovers remain a powerhouse.
Compact Non-Premium SUVs held a 21.1% annual U.S. market share in 2024, up 1.3 percentage points from 2023.
They also captured 21.1% share in December 2024, indicating consistent segment strength throughout the year.
Growth continues to spread across vehicle sizes.
U.S. subcompact crossover/SUV sales grew 24% year-to-date in 2025, while U.S. compact crossover/SUV sales rose 8% year-to-date in 2025.
| U.S. crossover/SUV metric | Statistic |
|---|---|
| SUV share of U.S. new-vehicle sales, 2025 | 52% |
| SUV share of U.S. new-vehicle sales, 2016 | 38% |
| Utility share of U.S. light-vehicle sales, 2020 | 50% |
| Forecast utility share, 2021 | 52% |
| Car SUV production share, MY 2023 | 12% |
| Truck SUV production share, MY 2024 | 50% |
| Combined car and truck SUV production share, MY 2023 | 58% |
| Compact Non-Premium SUV U.S. market share, 2024 | 21.1% |
| Subcompact crossover/SUV sales growth, 2025 YTD | 24% |
| Compact crossover/SUV sales growth, 2025 YTD | 8% |
More than half of all U.S. new vehicles sold in 2025 were SUVs.
Best-selling crossover SUV models and rankings
Model-level crossover SUV statistics show just how concentrated consumer demand can become around proven nameplates.
Toyota RAV4 was the world’s best-selling light vehicle in 2024 with 1,187,000 registered units, up 11%.
That is an extraordinary result for a crossover, especially considering it beat every sedan, hatchback, and pickup in the global market.
Tesla Model Y ranked second globally in 2024 with 1,185,000 units, although that total was down 3%.
Toyota Corolla Cross/Frontlander sold 859,000 units globally, up 18%, and Honda CR-V/Breeze sold 854,000 units, up 1%.
The RAV4’s geographical mix is also revealing.
Its 2024 global volume was 41% U.S., 28% China including the Wildlander, 7% Europe, and under 3% Japan.
That split underscores how heavily the world’s top crossover depends on North America and China.
| Global crossover/light-vehicle ranking, 2024 | Units | Year-over-year change |
|---|---|---|
| Toyota RAV4 | 1,187,000 | +11% |
| Tesla Model Y | 1,185,000 | -3% |
| Toyota Corolla Cross/Frontlander | 859,000 | +18% |
| Honda CR-V/Breeze | 854,000 | +1% |
In the United States, the crossover leaderboard is equally clear.
Toyota sold 475,193 RAV4 units in 2024, Honda sold 402,791 CR-V units, and Nissan sold 245,723 Rogue units.
Through 2025, Toyota RAV4 U.S. sales totaled 437,260 units, up 1.48% from 430,897 in 2024.
Honda CR-V reached 368,618 units, up 1.44% from 363,388.
One of the biggest jumps came from Chevrolet: Equinox sales hit 273,270 units, up 47.97% from 184,683, while Chevrolet Trax rose to 191,059 units, up 4.74%.
Toyota RAV4 was also the best-selling SUV in the United States for the seventh consecutive year in 2023, reinforcing its exceptional staying power.
| Top U.S. crossover/SUV nameplates | 2024 or 2025 volume | Change |
|---|---|---|
| Toyota RAV4 (U.S. 2024) |
475,193 | — |
| Honda CR-V (U.S. 2024) |
402,791 | — |
| Nissan Rogue (U.S. 2024) |
245,723 | — |
| Toyota RAV4 (U.S. 2025 YTD) |
437,260 | +1.48% |
| Honda CR-V (U.S. 2025 YTD) |
368,618 | +1.44% |
| Chevrolet Equinox (U.S. 2025 YTD) |
273,270 | +47.97% |
| Chevrolet Trax (U.S. 2025 YTD) |
191,059 | +4.74% |
Electric and hybrid crossover SUV statistics
Electrification is increasingly running through the crossover category rather than around it.
In model year 2024, car SUVs accounted for 30% BEVs and another 3% PHEVs.
That means nearly one-third of the EPA’s unibody crossover class was already battery-electric, with plug-in hybrids adding a further slice.
BEV and PHEV penetration raised average car SUV fuel economy by 9.0 mpg in model year 2024.
In model year 2023, BEVs accounted for 36% of all U.S. car SUVs, and car SUVs improved fuel economy by 7.2 mpg, becoming the highest-fuel-economy vehicle type.
That is a major crossover SUV trend: the body style often criticized for efficiency has become one of the primary delivery systems for efficiency gains once electrification is layered in.
Retail demand is moving in the same direction.
Electric SUVs represented 8% of the U.S.
SUV segment in 2025.
Tesla Model Y reached 146,000 U.S. sales through Q2 2025, while Chevrolet Equinox EV sold 27,749 units in the first half of 2025, making it the best-selling non-Tesla electric SUV in that period.
Hybridization remains a major bridge technology.
The Toyota RAV4 hybrid variant made up 35% of RAV4 sales in 2025 and delivered 39 mpg combined.
More broadly, hybrid SUVs and crossovers helped electrified powertrains capture 21.2% of U.S.
Q3 2024 sales when combining BEVs, PHEVs, and hybrids.
Toyota Division electrified vehicles represented 29.3% of total 2023 U.S. sales volume, heavily supported by hybrid crossover demand.
- 30% of MY 2024 car SUVs were BEVs.
- 3% of MY 2024 car SUVs were PHEVs.
- 36% of MY 2023 U.S. car SUVs were BEVs.
- 8% of the U.S.
SUV segment was electric in 2025.
- 35% of RAV4 sales were hybrid in 2025.
- 21.2% of U.S.
Q3 2024 sales were electrified when BEVs, PHEVs, and hybrids were combined.
Pricing, fuel economy, and efficiency benchmarks
The average U.S.
SUV transaction price reached USD 43,000 in 2025, showing that crossovers are not just volume leaders—they are also strong revenue generators at retail.
Efficiency stats suggest buyers are not giving up operating cost concerns.
Crossover units achieving 15.5 to 18.1 km/L fuel efficiency gained market share in 2024, indicating that fuel economy remains a competitive differentiator even in a utility-dominated market.
For improved internal-combustion models, U.S. compact crossover real-world fuel economy stands at 28.6 mpg in the small-CUV segment.
On the electrified side, the gains are larger still, as shown by the EPA’s fuel economy improvements for car SUVs.
The crossover SUV category increasingly wins on both convenience and efficiency.
Buyers are paying premium-like average transaction prices, yet demand is still gravitating toward models with better mpg or stronger electrified credentials.
Industry structure and competitive crossover market data
Toyota, Volkswagen Group, Hyundai Motor, Stellantis, and General Motors accounted for roughly three-fifths of 2024 global crossover deliveries.
That concentration shows how much scale matters in this segment, especially where platforms, supply chains, and regional manufacturing footprints are concerned.
On the manufacturing side, electrification capacity is being built specifically around crossover demand.
CATL and BYD are building 150 GWh of new battery capacity slated to come online by 2027 for crossover electrification.
Kia’s Gwangmyeong EVO Plant is designed to output up to 150,000 electrified crossovers annually.
Battery cost is another foundational stat.
Average lithium-ion battery pack prices for BEV crossovers were USD 139 per kWh in 2024.
That figure matters because battery pack economics heavily influence EV crossover pricing, margin structure, and the speed of mainstream adoption.
Global competition is also being reshaped by China.
Chinese crossover exports undercut Western equivalents by roughly half while bundling advanced driver-assist features.
That combination of lower price and higher perceived tech value has major implications for brand positioning and international market share.
There are also notable classification quirks in the U.S. market.
Among U.S.
SUVs with inertia weight of 4,000 pounds or less, 72% met the regulatory truck-SUV definition in model year 2023.
And among major manufacturers, Tesla had the highest share of car SUV production at 55% in model year 2023.
- About 60% of global crossover deliveries were controlled by five automaker groups in 2024.
- 150 GWh of new battery capacity from CATL and BYD is slated by 2027.
- 150,000 electrified crossovers per year is the design output of Kia’s Gwangmyeong EVO Plant.
- USD 139/kWh was the average lithium-ion battery pack price for BEV crossovers in 2024.
- Roughly half-price Chinese crossover exports are challenging Western incumbents.