Table of Contents
- SUV insurance statistics at a glance
- Table of contents
- Average SUV insurance cost statistics
- SUV vs sedan and other vehicle-type insurance statistics
- SUV insurance statistics by segment
- Cheapest and most expensive SUVs to insure
- Cheapest insurers for SUV coverage
- National and state market benchmarks for SUV insurance statistics
- SUV claims, theft, glass, and loss statistics
- Why SUV insurance is often cheaper than expected
SUV insurance statistics at a glance
SUVs often cost less to insure than sedans, but the category is anything but uniform: a compact crossover can be relatively affordable while a luxury performance SUV can push premiums into exotic-car territory.
The most interesting takeaway from the data is how consistently SUVs outperform many other vehicle types on insurance costs and loss experience, even as high-end SUV segments sharply inflate the upper end of the market.
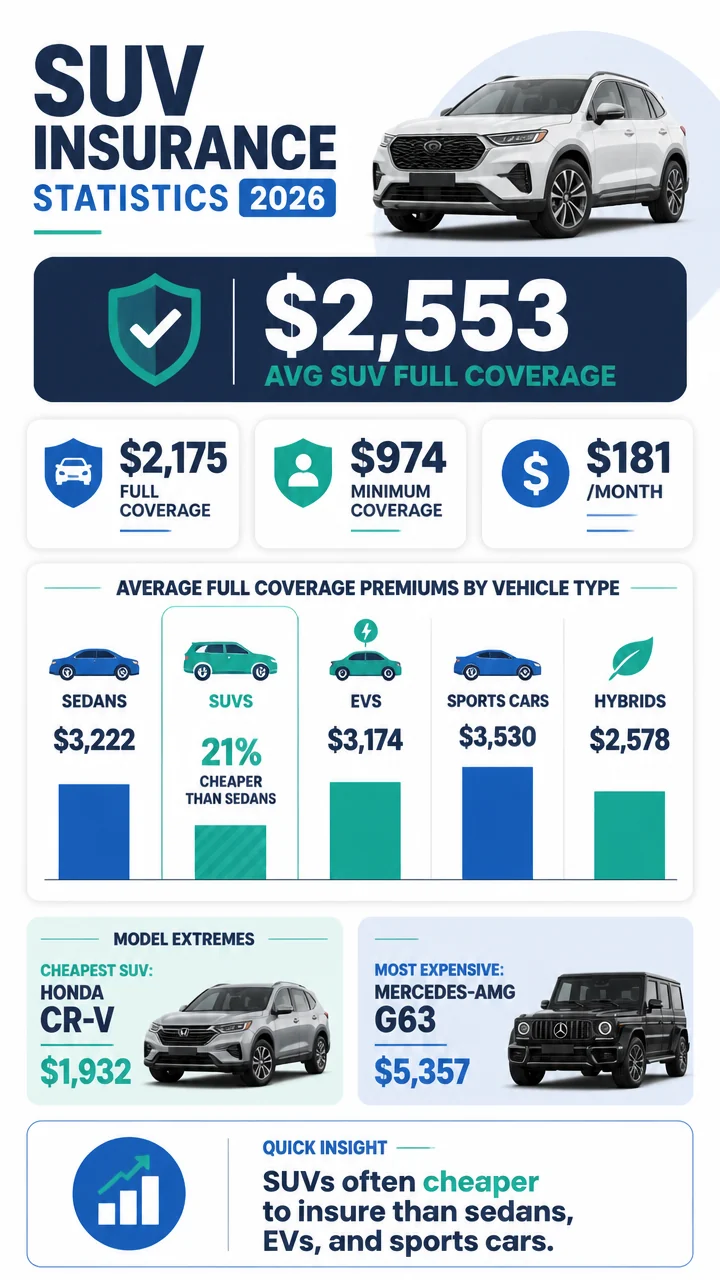
Big number: Average annual SUV insurance premiums range from $2,175 for full coverage in MoneyGeek’s 2026 quote analysis to $2,553 in Insure.com’s SUV rate study, depending on methodology, limits, and vehicle set.
Fast facts:
- $2,553 average annual full-coverage SUV premium in Insure.com data.
- $2,316 average annual SUV premium in CarInsurance.com’s vehicle-type index.
- $2,175 average annual full-coverage SUV premium in MoneyGeek’s 2026 analysis.
- $974 average annual minimum-coverage SUV premium in MoneyGeek’s data.
- $1,932 annual premium for the Honda CR-V, the cheapest SUV in Insure.com’s model rankings.
- $5,357 annual premium for the Mercedes-AMG G63, the most expensive SUV in Insure.com’s rankings.
Table of contents
- Average SUV insurance cost statistics
- SUV vs sedan and other vehicle-type insurance statistics
- SUV insurance statistics by segment
- Cheapest and most expensive SUVs to insure
- Cheapest insurers for SUV coverage
- National and state market benchmarks
- SUV claims, theft, glass, and loss statistics
- Why SUV insurance is often cheaper
Average SUV insurance cost statistics
SUV drivers pay about $2,553 per year for full coverage with 100/300/100 limits and $500 deductibles, according to Insure.com’s SUV insurance rate data.
That figure gives a strong benchmark for shoppers comparing mainstream SUV ownership costs against other body styles.
MoneyGeek’s 2026 analysis puts full-coverage SUV insurance at $2,175 per year, or $181 per month, based on 80,676 quotes.
In the same study, minimum coverage averages $974 annually, or $81 per month.
CarInsurance.com estimates SUV insurance at $2,316 annually across roughly 3,000 model-year 2024 vehicles in its 2025 vehicle-type index.
Even though that estimate differs from Insure.com and MoneyGeek, all three datasets place SUVs in a relatively moderate-cost band rather than among the most expensive vehicle classes.
Key takeaway: Across major datasets, average SUV insurance clusters between $2,175 and $2,553 per year for full coverage or comparable vehicle-type averages.
| Source | Metric | Average SUV Premium |
|---|---|---|
| Insure.com | Full coverage, 100/300/100, $500 deductible | $2,553/year |
| CarInsurance.com | Vehicle-type index average | $2,316/year |
| MoneyGeek 2026 | Full coverage | $2,175/year or $181/month |
| MoneyGeek 2026 | Minimum coverage | $974/year or $81/month |
The spread inside the SUV category is enormous. MoneyGeek found full-coverage premiums ranging from $426 to $6,510 annually depending on age, SUV type, and coverage level.
That range shows why averages are useful for benchmarking but not enough for pricing a specific vehicle.
SUV vs sedan and other vehicle-type insurance statistics
SUVs are usually cheaper to insure than sedans. In Insure.com’s rate study, the average annual sedan premium was $3,222, about 21% higher than the average SUV premium of $2,553.
CarInsurance.com found a smaller but still meaningful gap: sedans averaged $2,403 per year compared with $2,316 for SUVs.
In MoneyGeek’s 2026 data, full-coverage sedan insurance averaged $2,618, which was $443 more than the $2,175 SUV average.
SUVs also compare favorably with several other vehicle classes. CarInsurance.com’s national vehicle-type breakdown shows hatchbacks averaging $2,335, hybrids at $2,578, electric vehicles at $3,174, and sports cars at $3,530.
Why it matters: SUVs are not just cheaper than sedans in several datasets; they also come in far below EVs and sports cars, two categories that materially raise the market average.
| Vehicle Type | Average Annual Premium | Difference vs SUVs |
|---|---|---|
| SUVs | $2,316 | Baseline |
| Sedans | $2,403 | $87 more |
| Hatchbacks | $2,335 | $19 more |
| Hybrids | $2,578 | $262 more |
| Electric vehicles | $3,174 | $858 more |
| Sports cars | $3,530 | $1,214 more |
Older ownership-cost data points in the same direction.
AAA’s 2022 Your Driving Costs study found average full-coverage insurance for a medium SUV was $1,529, versus $1,694 for a medium sedan.
AAA’s broader all-vehicle insurance estimate was $1,588, again placing medium SUVs in a relatively competitive position.
SUV insurance statistics by segment
Not all SUVs are priced alike. Segment data from MoneyGeek shows compact and non-luxury SUVs are the affordability sweet spot, while luxury SUV categories push costs up fast.
- Compact SUVs: $170 per month or $2,034 per year for full coverage.
- General non-luxury SUVs: $171 per month or $2,053 per year.
- Luxury compact SUVs: $193 per month or $2,316 per year.
- Luxury SUVs: $220 per month or $2,645 per year.
Compact SUVs are the cheapest SUV segment to insure, while luxury SUVs are the most expensive.
The difference between those two categories is $611 per year in MoneyGeek’s full-coverage analysis.
Minimum-coverage premiums by SUV category were much tighter, ranging from just $80 to $83 per month across compact, luxury, and standard SUV groups.
That suggests vehicle segment differences show up more dramatically once collision and comprehensive coverage are added.
At a glance: The data suggests the real pricing divide is not “SUV vs non-SUV,” but mainstream compact SUV vs luxury SUV.
| SUV Segment | Full-Coverage Monthly Premium | Full-Coverage Annual Premium |
|---|---|---|
| Compact SUVs | $170 | $2,034 |
| General non-luxury SUVs | $171 | $2,053 |
| Luxury compact SUVs | $193 | $2,316 |
| Luxury SUVs | $220 | $2,645 |
Small SUV-specific data reinforces that trend.
Insuraviz found the average annual insurance cost for 47 small SUVs was $2,206, which was $70 below the $2,276 national all-vehicle average.
In other words, small SUVs were slightly cheaper than the broad market average even before comparing them to luxury utility vehicles.
Cheapest and most expensive SUVs to insure
The cheapest SUVs to insure are mostly compact mainstream models. The Honda CR-V leads Insure.com’s rankings at $1,932 per year, or $161 per month.
- Honda CR-V: $1,932/year
- Honda HR-V: $1,936/year
- Volkswagen Tiguan: $1,979/year
- Chevrolet TrailBlazer: $2,012/year
- Subaru Forester: $2,013/year
- Mazda CX-5: $2,021/year
- Toyota RAV4: $2,085/year or $174/month
The Honda HR-V is only $4 more expensive than the CR-V in Insure.com’s list, showing how tightly clustered the cheapest end of the SUV market can be.
Other sources identify similar low-cost leaders.
MoneyGeek says the Honda CR-V has the lowest full-coverage SUV rate at $154 per month, while the Subaru Forester has the lowest minimum-coverage rate at $73 per month.
Insuraviz found the 2024 Subaru Crosstrek was the cheapest small SUV to insure at $1,772 per year, or $148 per month.
Pull quote: Cheap SUV insurance is overwhelmingly a compact-SUV story. CR-V, HR-V, Crosstrek, Forester, Tiguan, and RAV4 all show up near the low end.
| Cheapest SUVs to Insure | Average Premium | Source |
|---|---|---|
| Honda CR-V | $1,932/year | Insure.com |
| Honda HR-V | $1,936/year | Insure.com |
| Volkswagen Tiguan | $1,979/year | Insure.com |
| Chevrolet TrailBlazer | $2,012/year | Insure.com |
| Subaru Forester | $2,013/year | Insure.com |
| Mazda CX-5 | $2,021/year | Insure.com |
| Toyota RAV4 | $2,085/year | Insurance.com |
| 2024 Subaru Crosstrek | $1,772/year | Insuraviz |
At the expensive end, performance and luxury branding dominate. Insure.com lists the Mercedes-AMG G63 at $5,357 per year as the most expensive SUV to insure.
- Mercedes-AMG G63: $5,357/year
- BMW X6 M: $5,067/year
- Maserati Levante: $5,042/year
- Audi RS Q8: $4,998/year
- Tesla Model X: $4,805/year
- Land Rover Range Rover: $4,790/year
MoneyGeek likewise names the BMW X7 as the most expensive SUV in its model table at $296 per month for full coverage.
Insuraviz found the 2024 Ford Mustang Mach-E was the most expensive small SUV to insure in its comparison at $2,806 per year.
The gap between the cheapest and most expensive SUVs is startling. Comparing Insure.com’s top and bottom rankings, the Mercedes-AMG G63 costs $3,425 more per year to insure than the Honda CR-V.
Cheapest insurers for SUV coverage
Carrier choice can move SUV premiums almost as much as model choice. In MoneyGeek’s cheapest-company table, State Farm offers the lowest analyzed full-coverage SUV rate at $94 per month.
GEICO follows at $99 per month for the cheapest analyzed full-coverage SUV rate in the same comparison.
Key takeaway: On a monthly basis, the difference between an average SUV premium of $181 and a lowest-analyzed company rate of $94 is substantial.
- State Farm: $94/month full coverage
- GEICO: $99/month full coverage
These numbers do not mean every driver will qualify for those rates, but they show how aggressively shopping around can affect SUV insurance costs.
National and state market benchmarks for SUV insurance statistics
SUV insurance should be viewed against a rising national auto insurance market. NAIC data shows the countrywide average auto insurance expenditure rose 6.1% to $1,127 in 2022 from $1,062 in 2021.
That acceleration continued.
The NAIC countrywide average auto insurance expenditure reached $1,281 in 2023, up 13.98% from 2022.
The combined average premium for liability, collision, and comprehensive climbed to $1,438 in 2023, up 14.41% year over year.
The median state average auto insurance expenditure was $1,114 in 2023, highlighting how much state-level variation exists around the national midpoint.
Experian’s 2026 marketplace data puts the broader cost environment even higher for consumers shopping today: the national average cost of car insurance was $2,276 annually, or $190 per month.
Full coverage averaged $2,926 per year, while minimum coverage averaged $1,572.
| National Benchmark | Figure |
|---|---|
| NAIC average expenditure, 2022 | $1,127 |
| NAIC average expenditure, 2023 | $1,281 |
| NAIC combined average premium, 2023 | $1,438 |
| Experian average car insurance cost, 2026 | $2,276/year |
| Experian average full coverage, 2026 | $2,926/year |
| Experian average minimum coverage, 2026 | $1,572/year |
State extremes remain dramatic.
In NAIC’s 2022 expenditure figures, Florida had the highest average at $1,625.
In Experian’s 2026 full-coverage state table, Maryland had the highest average full-coverage premium at $4,222 per year, while Vermont had the lowest at $1,404.
Why it matters: Even if SUVs are often cheaper to insure than sedans, geography can still overwhelm vehicle-type savings.
SUV claims, theft, glass, and loss statistics
Claims data helps explain why SUVs often price well. HLDI’s 2020-22 model data shows SUVs had a comprehensive claim frequency of 81.6 claims per 1,000 insured vehicle years.
More importantly for insurers, SUV comprehensive overall losses averaged $179 per insured vehicle year, versus $212 for passenger cars and $184 for pickups.
That puts SUVs below both passenger cars and pickups on this measure.
SUV theft claim frequency was just 1.3 claims per 1,000 insured vehicle years, compared with 2.0 for passenger cars and 2.4 for pickups.
Lower theft frequency is one of the clearest data-backed reasons some SUVs can be cheaper to insure.
There is one area where SUVs are worse: glass claim frequency was 60.2 claims per 1,000 insured vehicle years, higher than 54.2 for passenger cars.
Still, severity remains favorable.
SUV comprehensive claim severity averaged $2,194 per claim, versus $2,594 for passenger cars.
Big number: HLDI gives all SUVs a relative comprehensive overall loss score of 95 on a 100-average scale, indicating they run about 5% below average.
| Loss Metric | SUVs | Passenger Cars | Pickups |
|---|---|---|---|
| Comprehensive overall losses per insured vehicle year | $179 | $212 | $184 |
| Theft claim frequency per 1,000 insured vehicle years | 1.3 | 2.0 | 2.4 |
| Glass claim frequency per 1,000 insured vehicle years | 60.2 | 54.2 | — |
| Comprehensive claim severity per claim | $2,194 | $2,594 | — |
Segment-level loss data shows the same affordability split seen in premium data.
- Small SUVs: relative comprehensive overall losses of 84, or 16% below the all-vehicle average.
- Midsize luxury SUVs: relative comprehensive overall losses of 118, or 18% above average.
- Large luxury SUVs: relative comprehensive overall losses of 210, more than double the average.
NHTSA’s HLDI-based collision ratings tell a similar story.
All sport utility vehicles averaged 88 on a 100-average collision-loss scale for 2017-19 model years.
Small sport utility vehicles scored 81, which was 19% better than average, while large luxury sport utility vehicles scored 144, or 44% worse than average.
At the model level, the Toyota RAV4 4WD had a collision loss rating of 96, slightly better than average, while the Cadillac Escalade ESV scored 122, or 22% worse than average.
Additional HLDI-based data cited by MoneyGeek found SUVs perform 3% to 7% better than average across all major insurance loss categories in recent comparisons.
PIP data adds another wrinkle.
Small SUVs had relative PIP overall losses of 106 for 2018-20 models, slightly above average, while very large SUVs scored 72 and large luxury SUVs scored 61, both well below average.
For context, four-door microcars were at 240, versus 106 for small SUVs.
Why SUV insurance is often cheaper than expected
The data points to several clear reasons SUVs often cost less to insure than many shoppers expect.
- Lower losses than passenger cars: SUVs posted $179 in comprehensive overall losses per insured vehicle year versus $212 for passenger cars.
- Lower theft frequency: SUVs saw 1.3 theft claims per 1,000 insured vehicle years, below both passenger cars and pickups.
- Strong small-SUV performance: Small SUVs carried a relative comprehensive loss score of 84 and a collision score of 81, both better than average.
- Mainstream model concentration: Many top-selling SUVs are compact, non-luxury models that repeatedly rank among the cheapest to insure.
But the same category also contains some of the market’s costliest vehicles. Large luxury SUVs and performance SUVs post much worse loss scores and much higher premiums, which is why the SUV label alone does not guarantee low insurance costs.
Fast facts:
- The top five cheapest SUVs averaged under $1,172 for a six-month premium in CarInsurance.com data cited by AOL.
- The cheapest analyzed sedan in that same comparison was $1,265 for six months.
- The Subaru Crosstrek had the lowest average monthly insurance premium among analyzed vehicles in CarInsurance.com’s cheapest-cars ranking at $192 per month.