Table of Contents
- SUV theft statistics: the big picture
- Table of contents
- Key takeaways
- U.S. SUV theft statistics and national trends
- Most stolen SUVs and model-level theft statistics
- SUV theft statistics by claim frequency and insurance benchmark
- SUV theft statistics by SUV class
- Highest-risk SUV models in theft claim data
- Lowest-risk SUV models in theft claim data
- State and metro vehicle theft statistics that shape SUV risk
- Canada SUV theft statistics
- SUV catalytic converter theft statistics
SUV theft statistics: the big picture
SUV theft trends look contradictory at first glance: a handful of models are magnets for thieves, yet SUVs as a category still post lower theft claim frequencies than pickups and even passenger cars in several model-year studies.
That tension is exactly what makes the latest SUV theft statistics so revealing.
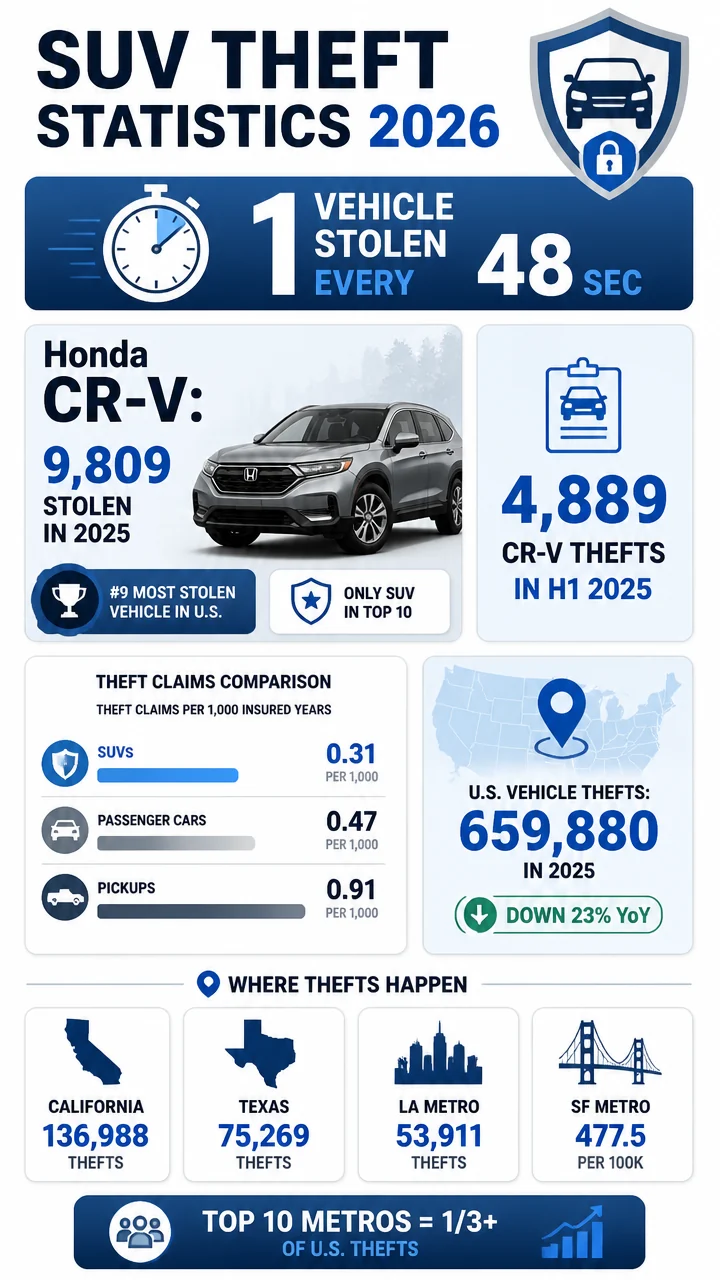
In the United States, the Honda CR-V was the highest-volume stolen SUV in 2025 and the only SUV to crack NICB’s top 10 most-stolen vehicles overall, while insurance data shows SUVs averaged just 0.31 whole-vehicle theft claims per 1,000 insured vehicle years for 2022-24 models.
Big number: One car, truck, or SUV is stolen every 48 seconds in the United States as of 2025.
Table of contents
- Key takeaways
- U.S.
SUV theft statistics and national trends
- Most stolen SUVs and model-level data
- SUV theft rates, claim frequency, and insurance benchmarks
- SUV theft statistics by SUV class
- Highest-risk SUV models in insurance data
- Lowest-risk SUV models in insurance data
- State and metro vehicle theft statistics that shape SUV risk
- Canada SUV theft statistics
- SUV catalytic converter theft statistics
Key takeaways
At a glance
- 9,809 Honda CR-Vs were reported stolen in the U.S. in 2025, ranking #9 among all vehicles.
- 4,889 Honda CR-V thefts were reported in the first half of 2025 alone.
- 659,880 U.S. vehicle thefts were reported in 2025, down 23% from 2024.
- 0.31 SUV whole-vehicle theft claims per 1,000 insured vehicle years were recorded for 2022-24 models.
- SUV theft frequency was lower than pickups (0.91) and passenger cars (0.47) for 2022-24 models.
- Large luxury SUVs (187) and large SUVs (171) had the highest relative theft frequency indexes among SUV classes.
- The Dodge Durango SRT Hellcat posted a huge relative theft frequency of 5,282 for 2021-23 models.
- In Canada, the Toyota RAV4 was the most stolen vehicle in 2024 with 2,080 thefts.
U.S. SUV theft statistics and national trends
The broad national trend is moving in the right direction.
U.S. vehicle thefts fell to 659,880 in 2025, a 23% decrease from 2024, according to NICB.
That follows 850,708 thefts in 2024, which was already down 17% from the 2023 peak of 1,020,729.
The first-half data points in the same direction.
NICB reported 334,114 thefts in Q1-Q2 2025, also down 23% versus the first half of 2024.
The national theft rate fell from 126.62 per 100,000 residents in H1 2024 to 97.33 in H1 2025.
For SUV owners, the important nuance is that falling national theft totals do not eliminate model-level concentration.
Theft risk remains highly uneven, with specific SUVs dramatically overrepresented in both police totals and insurance claims.
| U.S. vehicle theft trend | Figure |
|---|---|
| 2023 total thefts | 1,020,729 |
| 2024 total thefts | 850,708 |
| 2025 total thefts | 659,880 |
| 2024 YoY change | -17% |
| 2025 YoY change | -23% |
| H1 2025 thefts | 334,114 |
| H1 2025 vs H1 2024 | -23% |
| 2024 national theft rate | 250.2 per 100,000 |
| H1 2025 national theft rate | 97.33 per 100,000 |
Why it matters: Even with thefts falling nationally, the SUV story is still about concentration.
A small set of models and locations continue to drive outsize theft exposure.
Most stolen SUVs and model-level theft statistics
The clearest headline in the latest SUV theft statistics is the dominance of the Honda CR-V in U.S. theft counts.
The Honda CR-V was the only SUV in NICB’s 2025 national top-10 most-stolen list, with 9,809 reported thefts, ranking #9 overall.
That was not a one-off full-year spike hidden by later timing.
In the first half of 2025, the Honda CR-V logged 4,889 thefts, also ranking #9 among all U.S. models.
NICB model-level totals identified it as the highest-volume stolen SUV in the United States in 2025.
This concentration is notable because it happened during a year when the Toyota RAV4 did not appear on the U.S. top-10 list, even though the RAV4 was Canada’s most stolen vehicle.
That contrast suggests SUV theft patterns can differ sharply by market, fleet mix, and local criminal demand.
State-level snapshots reinforce the CR-V’s prominence.
In New York State, the Honda CR-V was the most stolen vehicle in 2024, with 1,776 units reported stolen.
Pull quote: 9,809 Honda CR-V thefts made it the only SUV in America’s top 10 most-stolen vehicles in 2025.
| U.S. SUV theft snapshot | Figure | Source context |
|---|---|---|
| Honda CR-V thefts, 2025 | 9,809 | #9 among all U.S. vehicles |
| Honda CR-V thefts, H1 2025 | 4,889 | #9 among all U.S. models |
| Honda CR-V in New York, 2024 | 1,776 | Most stolen vehicle in state |
SUV theft statistics by claim frequency and insurance benchmark
Police theft totals tell one story, but insurance claim frequency helps explain whether SUVs as a category are inherently more theft-prone than other vehicle types.
On that measure, the answer is generally no.
For 2022-24 model years, SUVs posted a whole-vehicle theft claim frequency of 0.31 claims per 1,000 insured vehicle years.
That was lower than pickups at 0.91 and lower than passenger cars at 0.47.
The same pattern shows up in earlier periods:
- For 2021-23 models, SUVs averaged 0.35 claims per 1,000 insured vehicle years.
- For 2020-22 models, SUVs averaged 0.32 claims per 1,000 insured vehicle years.
- For 2020-22 models, passenger cars were higher at 0.55.
- For 2021-23 models, pickups ran at 0.82, more than double the SUV rate of 0.35.
Loss data tells a similar story.
For 2022-24 models, SUV overall whole-vehicle theft losses averaged $15 per insured vehicle year.
For 2021-23 models, SUV theft losses averaged $17 per insured vehicle year, versus $53 for pickups.
Still, lower frequency does not mean lower severity when a theft actually happens.
The average whole-vehicle theft claim severity for SUVs was $48,750 for 2022-24 model years.
| Vehicle type benchmark | 2022-24 theft claim frequency |
|---|---|
| SUVs | 0.31 per 1,000 insured vehicle years |
| Passenger cars | 0.47 per 1,000 |
| Pickups | 0.91 per 1,000 |
Fast fact: All SUVs combined generated 7,854 whole-vehicle theft claims across 25,068,028 insured vehicle years for 2022-24 models.
SUV theft statistics by SUV class
One of the most useful takeaways in the dataset is that not all SUV segments behave the same.
HLDI’s relative claim frequency indexes, where 100 equals the all-passenger-vehicle average, show major variation across SUV classes.
- Small SUVs: 77
- Midsize SUVs: 57
- Large SUVs: 171
- Very large SUVs: 69
- Small luxury SUVs: 28
- Large luxury SUVs: 187
The most striking split is between mainstream compact and midsize SUVs, which sit below the passenger-vehicle average, and large luxury SUVs, which sit far above it.
Large luxury SUVs posted a relative theft frequency of 187, while small luxury SUVs came in at just 28.
Severity can also spike at the top end.
Very large luxury SUVs had a relative theft claim severity index of 301 for 2022-24 models, highlighting how expensive these thefts can become even when frequency is not always the highest.
| SUV class | Relative theft frequency index |
|---|---|
| Small luxury SUVs | 28 |
| Midsize SUVs | 57 |
| Very large SUVs | 69 |
| Small SUVs | 77 |
| Large SUVs | 171 |
| Large luxury SUVs | 187 |
Highest-risk SUV models in theft claim data
At the model level, some SUVs post theft rates that are dramatically out of line with the category average.
The standout extreme is the Dodge Durango SRT Hellcat, which recorded a relative whole-vehicle theft claim frequency of 5,282 for 2021-23 models.
That is an eye-popping outlier and one of the strongest figures anywhere in the dataset.
Other high-risk SUV models include:
- Dodge Durango 4WD: relative theft claim frequency of 592 for 2022-24 models.
- Land Rover Range Rover 4WD: 540 for 2022-24 models.
- Honda CR-V hybrid 4WD: 340 for 2022-24 models.
- BMW X7 4WD: 277 for 2022-24 models.
- Cadillac Escalade ESV 4WD: 260 for 2022-24 models.
- Honda CR-V 4WD: 409 for 2020-22 models.
- Kia Sportage 4WD: 415 for 2020-22 models.
- Kia Sportage 2WD: 479 for 2020-22 models.
The loss side can be even more dramatic.
The Land Rover Range Rover 4WD posted relative overall theft losses of 1,551 for 2020-22 models, while the Dodge Durango 4WD posted relative overall theft losses of 535 for 2022-24, the highest among large SUVs.
| High-risk SUV model | Relative theft frequency | Model years |
|---|---|---|
| Dodge Durango SRT Hellcat | 5,282 | 2021-23 |
| Dodge Durango 4WD | 592 | 2022-24 |
| Land Rover Range Rover 4WD | 540 | 2022-24 |
| Kia Sportage 2WD | 479 | 2020-22 |
| Kia Sportage 4WD | 415 | 2020-22 |
| Honda CR-V 4WD | 409 | 2020-22 |
| Honda CR-V hybrid 4WD | 340 | 2022-24 |
| BMW X7 4WD | 277 | 2022-24 |
| Cadillac Escalade ESV 4WD | 260 | 2022-24 |
Why it matters: The SUV average looks moderate, but specific models can be many times riskier than the segment baseline.
Lowest-risk SUV models in theft claim data
Some SUVs land at the opposite end of the spectrum and are among the least theft-prone vehicles in the data.
- Tesla Model Y electric 4WD: relative theft frequency of 3 for 2020-22 models.
- Volvo XC90 4WD: 6 for 2021-23 models.
- Toyota RAV4 Prime plug-in hybrid 4WD: 10 for 2021-23 models.
These figures stand out because they are not just below high-risk SUV models; they are far below the all-passenger-vehicle benchmark of 100.
In other words, the spread inside the SUV category is enormous.
State and metro vehicle theft statistics that shape SUV risk
Geography matters almost as much as model choice.
California led all states with 136,988 vehicle thefts in 2025, accounting for more than 20% of the U.S. total.
Texas ranked second with 75,269 thefts.
At the state rate level, Washington, D.C. had the highest 2024 theft rate at 842.4 per 100,000 residents, more than three times the national average of 250.2.
D.C. also retained the highest H1 2025 rate at 373.09 per 100,000, nearly four times the H1 national rate of 97.33.
Metros are even more concentrated.
More than one-third of all U.S. vehicle thefts in 2025 occurred in the 10 metropolitan areas with the highest theft volumes. The Los Angeles-Long Beach-Anaheim metro area led the country with 53,911 thefts, while the San Francisco-Oakland-Fremont metro area posted the highest theft rate among metros with 1,000 or more thefts at 477.51 per 100,000 people.
There are also signs of meaningful improvement in some high-theft areas.
Washington State posted the largest state-level theft decline in 2025 at 39% year over year, after already leading 2024 theft declines with a 32% drop.
| Location metric | Figure |
|---|---|
| California thefts, 2025 | 136,988 |
| Texas thefts, 2025 | 75,269 |
| Los Angeles metro thefts, 2025 | 53,911 |
| San Francisco metro theft rate, 2025 | 477.51 per 100,000 |
| Washington, D.C. theft rate, 2024 | 842.4 per 100,000 |
| Washington, D.C. theft rate, H1 2025 | 373.09 per 100,000 |
| Washington State decline, 2025 | -39% |
Another national change worth watching: thefts involving Hyundai and Kia vehicles accounted for 14% of all U.S. vehicle thefts in 2025, down from 21% in 2023.
That matters to SUV theft trends because Kia and Hyundai utility vehicles had previously helped drive the broader theft surge.
Canada SUV theft statistics
The Canadian picture is even more SUV-heavy.
SUVs and trucks accounted for 9 of Canada’s top 10 most stolen vehicles in 2024, according to Equite Association.
The Toyota RAV4 was Canada’s most stolen vehicle in 2024 with 2,080 thefts from more than 554,000 insured units, equal to a 0.38% theft rate.
The Honda CR-V ranked third with 1,911 thefts and a 0.37% theft rate.
Several Canadian SUV models posted even higher rates:
- Lexus RX Series: 1.14% theft rate with 1,124 thefts.
- Jeep Wrangler: 1.03% theft rate with 1,491 thefts.
- Toyota Highlander: 0.90% theft rate with 1,141 thefts.
Regional differences echo the U.S. pattern of concentration.
In 2024, Ontario’s most stolen vehicle was the Honda CR-V, while Quebec’s was the Toyota RAV4.
Across Canada overall, a vehicle is stolen every 5 minutes.
| Canada SUV theft leaders, 2024 | Thefts | Theft rate |
|---|---|---|
| Toyota RAV4 | 2,080 | 0.38% |
| Honda CR-V | 1,911 | 0.37% |
| Jeep Wrangler | 1,491 | 1.03% |
| Toyota Highlander | 1,141 | 0.90% |
| Lexus RX Series | 1,124 | 1.14% |
Pull quote: In Canada, 9 of the top 10 most stolen vehicles in 2024 were SUVs or trucks.
SUV catalytic converter theft statistics
Whole-vehicle theft is only part of the SUV crime picture.
Catalytic converter theft remains a major issue, and SUVs are heavily represented in the target list.
In 2025, more than 137,000 catalytic converters were stolen in the United States.
Seven of the top 10 U.S. vehicles targeted for catalytic converter theft were SUVs, including the Hyundai Tucson, Ford Explorer, Chevrolet Traverse, Ford EcoSport, Ford Expedition, and Chevrolet Trax.
Among those, the Hyundai Tucson ranked #2 nationally and the Ford Explorer ranked #3 among vehicles most targeted for catalytic converter theft in 2025.
The economics help explain the trend:
- Standard catalytic converters can sell for $25 to $300.
- Hybrid SUV converters can fetch up to $1,400.
- Replacement after theft can cost owners up to $3,000.
For SUV owners, this means theft exposure is not limited to losing the entire vehicle.
High-value parts, especially on hybrids and commonly parked utility models, can also create substantial risk and repair costs.