Table of Contents
- SUV emissions statistics: the short version
- Table of contents
- Global SUV emissions statistics
- SUV sales and fleet growth statistics
- Why SUVs emit more than smaller cars
- U.S. SUV emissions statistics and transportation impact
- SUV emissions benchmarks, fuel economy, and production trends
- Electric SUV emissions statistics and life-cycle comparisons
- SUV emissions regulations and future CO2 targets
- Notable SUV manufacturer and market-shift statistics
SUV emissions statistics: the short version
SUVs are now so common that they are reshaping global transport emissions on their own.
The biggest headline is hard to ignore: global SUV combustion-related CO2 emissions hit 1 billion tonnes in 2023, even as many vehicle technologies became more efficient.
That tension runs through the entire dataset.
SUVs are selling at record levels, taking up a growing share of electric vehicle registrations, and getting cleaner in some categories, yet their size, weight, and popularity continue to push total emissions upward.
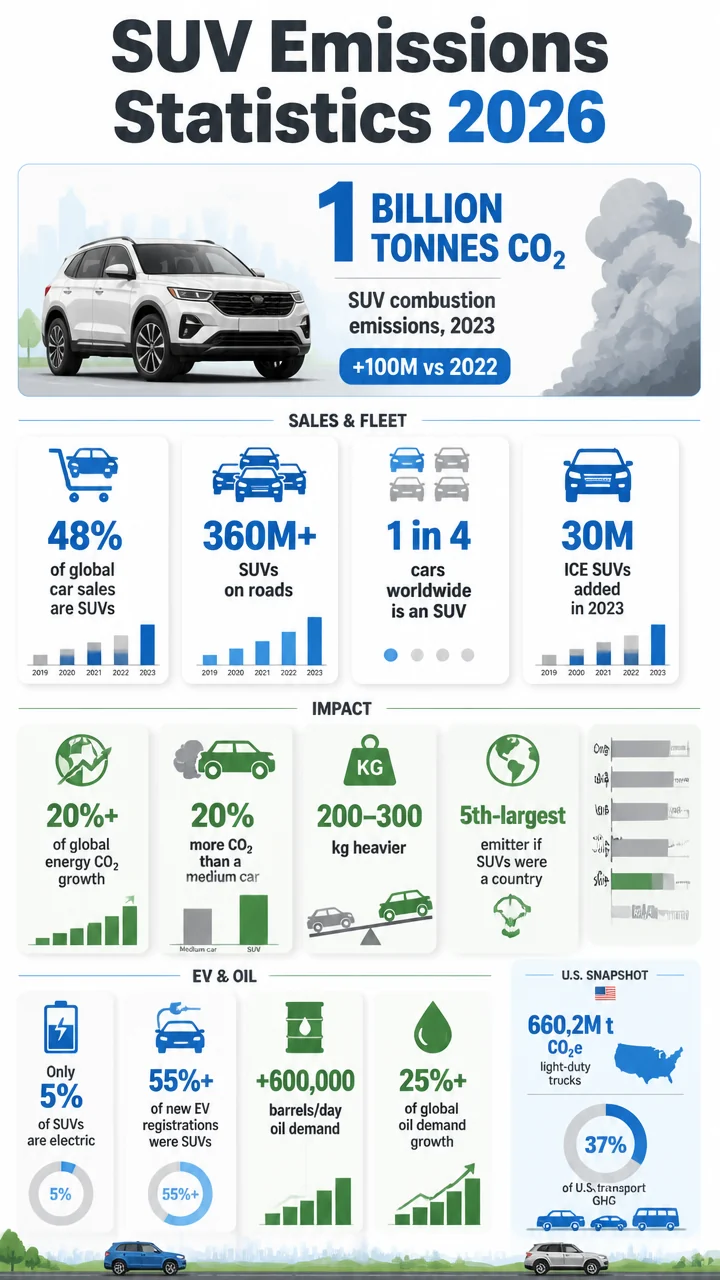
- 1 billion tonnes of global SUV combustion-related CO2 emissions in 2023.
- 48% of global car sales were SUVs in 2023, a record share.
- More than 360 million SUVs were on roads worldwide in 2023.
- Only 5% of SUVs on the road were electric as of 2023.
- About 30 million internal-combustion SUVs were added globally in 2023.
- 20% more CO2 emitted by SUVs versus an average medium-sized car.
- 660.2 million metric tons CO2e emitted by U.S. light-duty trucks in 2022.
- 37% of U.S. transportation GHG emissions came from light-duty trucks in 2022.
Table of contents
- Global SUV emissions statistics
- SUV sales and fleet growth statistics
- Why SUVs emit more
- U.S.
SUV emissions statistics
- SUV efficiency and CO2 benchmarks
- Electric SUV emissions statistics
- SUV emissions regulations and targets
- Notable industry and manufacturer stats
Global SUV emissions statistics
Global SUV combustion-related CO2 emissions reached 1 billion tonnes in 2023, according to the IEA.
That was roughly 100 million tonnes higher than 2022, a one-year jump large enough to make SUVs one of the most important transport-emissions stories in the world.
1,000,000,000 tonnes of CO2 is the defining figure in today’s SUV emissions debate.
SUVs accounted for more than 20% of the growth in global energy-related CO2 emissions in 2023. That means the category was not just a background contributor; it was a major driver of incremental emissions growth worldwide.
One of the most quoted comparisons in the dataset is that if the global SUV fleet were a country, it would rank as the world’s fifth-largest CO2 emitter, ahead of Japan and other major economies.
That framing helps explain why SUV emissions now matter far beyond auto-industry reporting.
More than one in four cars on the road worldwide are SUVs, and the global fleet topped 360 million SUVs in 2023.
Scale is the real story here: even when some models get cleaner, a huge and growing fleet can still raise total emissions.
- SUV emissions are no longer a niche issue tied to premium vehicles.
- The category is large enough to influence global CO2 growth.
- Fleet expansion is overwhelming part of the efficiency progress made elsewhere.
| Global SUV emissions metric | Figure |
|---|---|
| Combustion-related CO2 emissions, 2023 | 1 billion tonnes |
| Increase vs. 2022 |
About 100 million tonnes |
| Share of growth in global energy-related CO2 emissions | More than 20% |
| Global SUVs on the road | More than 360 million |
| Share of all cars on the road | More than 25% |
| Electric share of SUVs on the road | 5% |
SUV sales and fleet growth statistics
SUVs accounted for 48% of global car sales in 2023, up from about 20.6% in 2013.
In just a decade, SUVs went from roughly one-fifth of the market to nearly half.
In advanced economies, SUV sales reached about 20 million in 2023, pushing the category past 50% market share for the first time.
This is not a marginal shift anymore; in many mature markets, SUVs have become the default new-vehicle choice.
The fleet consequences are immediate.
About 30 million internal-combustion SUVs were added to the global fleet in 2023, which helps explain why emissions kept climbing even though electrification is expanding.
- 48% of global car sales were SUVs in 2023.
- Global SUV sales share was only 20.6% in 2013.
- Advanced economies bought about 20 million SUVs in 2023.
- More than 55% of new electric car registrations in 2023 were SUVs.
- 60% of the 500 electric car models available worldwide in 2023 were SUVs.
| SUV market growth statistic | Figure |
|---|---|
| Global SUV share of car sales, 2013 | 20.6% |
| Global SUV share of car sales, 2023 | 48% |
| Advanced economy SUV sales, 2023 | About 20 million |
| Advanced economy SUV market share, 2023 | More than 50% |
| Internal-combustion SUVs added globally, 2023 | About 30 million |
A striking contradiction sits inside these numbers.
Globally, SUVs account for about 45% of the electric car fleet, and in advanced economies they make up 55% of electric cars on the road.
Yet because the overall SUV fleet is so large, only 5% of SUVs on the road are electric.
That is a core takeaway for anyone tracking SUV emissions statistics: electric SUV growth is real, but it is still too small relative to the total SUV base to reverse the category’s near-term emissions trajectory.
Why SUVs emit more than smaller cars
SUVs emit roughly 20% more CO2 than an average medium-sized car.
The reasons in the dataset are simple and physical: they are larger, heavier, and less space-efficient.
SUVs weigh 200 to 300 kilograms more than an average medium-sized car.
They also require about 10% more parking space, another sign of how much larger the format has become.
The IEA notes that the trend toward heavier vehicles has largely nullified passenger-car fleet efficiency gains in recent decades.
That is one of the most important framing points in the data: technology has improved, but market mix has shifted toward vehicles that need more energy to move.
- 20% more CO2 than a medium-sized car is the rough SUV penalty in average use.
- 200–300 kg of extra weight helps explain higher fuel use and emissions.
- 10% more parking space illustrates their larger footprint beyond tailpipe output.
- Heavier vehicle trends have offset part of the efficiency progress elsewhere in the fleet.
Oil demand data tells the same story from a different angle.
Global oil consumption directly related to SUVs rose by more than 600,000 barrels per day over 2022 and 2023 combined.
Even more notably, SUV-related oil demand growth accounted for more than one quarter of overall annual global oil demand growth in that period.
That means SUVs are affecting not just climate metrics, but also fuel demand patterns at the global energy-system level.
U.S. SUV emissions statistics and transportation impact
The U.S. dataset uses a broader vehicle class, light-duty trucks, which includes SUVs, pickups, and minivans.
Still, it offers a powerful picture of how SUV-heavy consumer preferences shape emissions.
U.S. light-duty trucks emitted 660.2 million metric tons CO2e in 2022.
That was up 118.3% from 302.4 million metric tons in 1990, showing how dramatically this segment has grown as an emissions source.
Light-duty trucks were the largest U.S. transportation GHG source in 2022, at 37% of sector emissions.
Passenger cars, by comparison, accounted for 20% of U.S. transportation GHG emissions in 2022.
Combined, light-duty vehicles including SUVs contributed 57% of U.S. transportation GHG emissions, with one estimate putting the cars-and-light-trucks share at 57.5%.
The broader national context is also significant.
Transportation accounted for 28% of total U.S.
GHG emissions in 2022, while light-duty vehicles alone contributed 16% of total U.S.
GHG emissions before medium-duty vehicles are counted.
| U.S. transportation emissions statistic | Figure |
|---|---|
| Light-duty truck emissions, 2022 | 660.2 Mt CO2e |
| Light-duty truck emissions, 1990 | 302.4 Mt CO2e |
| Increase from 1990 to 2022 | 118.3% |
| Share of U.S. transportation emissions from light-duty trucks | 37% |
| Share from passenger cars | 20% |
| Share from light-duty vehicles including SUVs | 57% |
| Transportation share of total U.S. GHG emissions |
28% |
Activity levels remain huge.
Light-duty trucks traveled 1,634,533 million vehicle miles in the U.S. in 2022, and light-duty motor vehicle miles traveled increased 47% from 1990 to 2022.
The emissions breakdown for U.S. light-duty trucks also shows how dominant gasoline remains:
- 609.0 Tg CO2e from gasoline CO2
- 26.8 Tg CO2e from diesel CO2
- 11.4 Tg CO2e from methane
- 3.8 Tg CO2e from nitrous oxide
- 0.5 Tg CO2e from HFCs
For SEO readers looking for the plain-English takeaway: U.S.
SUV-heavy vehicle demand sits at the center of transportation emissions, both because these vehicles are popular and because they are driven enormous distances.
SUV emissions benchmarks, fuel economy, and production trends
The U.S.
EPA trend data shows two realities at once.
First, new vehicles are getting cleaner on average.
Average new U.S. vehicle real-world CO2 emissions fell to 319 g/mi in model year 2023, down 18 g/mi from 2022, while fuel economy reached 27.1 mpg, up 1.1 mpg.
Second, SUVs make up such a large share of production that category growth continues to dilute some fleetwide gains.
The EPA explicitly notes that long-term market shifts toward SUVs have offset some CO2 improvements despite record-low type-level emissions.
| U.S. SUV benchmark | CO2 emissions | Fuel economy |
|---|---|---|
| Car SUV, model year 2023 | 190 g/mi | 40.5 mpg |
| Truck SUV, model year 2023 | 356 g/mi | 24.7 mpg |
| Truck SUV, model year 2022 | 364 g/mi | N/A |
| Truck SUV, preliminary model year 2024 | 333 g/mi | N/A |
| Car SUV, preliminary model year 2024 | 190 g/mi | N/A |
Car SUVs had the lowest real-world CO2 emissions of any vehicle type in model year 2023 at 190 g/mi, helped in part by electrification.
By contrast, truck SUVs averaged 356 g/mi, nearly double the car-SUV level.
That split matters because the market is heavily weighted toward the truck-based side of the category.
Car SUVs represented 12.5% of new U.S. vehicles in model year 2023, while truck SUVs represented 45.3%.
Combined, car and truck SUVs exceeded half of all new U.S. vehicle production.
The long arc is even more dramatic.
Truck SUV production share rose from 1.7% in 1975 to 45.3% in 2023, while overall U.S. truck production share hit 62% in model year 2023, near an all-time high.
Truck SUV real-world CO2 averaged 806 g/mi in 1975, compared with 190 g/mi for car SUVs in 2023.
Vehicle technology has improved massively, but the market has also moved decisively toward larger formats.
Another useful data point: 36% of all model year 2023 car SUVs were BEVs.
That helps explain why car-SUV emissions dropped sharply.
Car SUV average CO2 fell 60 g/mi, or 24%, from 2022 to 2023, while truck SUV CO2 fell modestly from 364 to 356 g/mi.
At the same time, four-wheel-drive penetration reached 61% of new U.S. vehicles in model year 2023, and within trucks including truck SUVs it reached 83.0%.
Those trends can add weight and energy use, reinforcing the emissions challenge.
Electric SUV emissions statistics and life-cycle comparisons
Electric SUVs complicate the headline story in a useful way.
On one hand, SUVs have become a major part of the EV market.
On the other, electrified SUVs can deliver large emissions cuts compared with gasoline SUVs.
Model year 2024 BEV SUVs cut life-cycle GHG emissions by 71% to 74% versus conventional gasoline SUVs, depending on grid mix, according to ICCT.
PHEV SUVs cut life-cycle emissions 44%, and HEV SUVs cut them 27%.
- BEV SUVs: 71%–74% lower life-cycle GHG than conventional gasoline SUVs.
- PHEV SUVs: 44% lower life-cycle GHG.
- HEV SUVs: 27% lower life-cycle GHG.
- Conventional ICE SUVs emit up to 3.5 times more life-cycle GHG than BEV SUVs on the average U.S. grid.
- With 100% renewable electricity, ICE SUVs emit up to 6.7 times more.
The manufacturing penalty often cited for EVs is addressed directly in the dataset.
BEV SUV manufacturing emissions are paid back after about 11,800 miles versus a conventional ICE SUV.
The DOE GREET analysis reaches a similarly strong result: a 2024 small electric SUV with 300-mile range produces 52% fewer life-cycle GHG emissions than a comparable gasoline SUV.
For gasoline SUVs, about 75% of life-cycle GHG emissions come from tailpipe operation.
In the electric SUV case, electricity production and distribution average 149 gCO2e/mi, while battery production adds about 30 gCO2e/mi over the vehicle’s life.
The GREET comparison assumes 183,363 lifetime miles.
| Life-cycle SUV comparison | Figure |
|---|---|
| BEV SUV reduction vs. gasoline SUV | 71%–74% |
| PHEV SUV reduction vs. gasoline SUV | 44% |
| HEV SUV reduction vs. gasoline SUV | 27% |
| Manufacturing emissions payback for BEV SUV | About 11,800 miles |
| DOE GREET electric SUV reduction vs. gasoline SUV | 52% |
| Share of gasoline SUV life-cycle emissions from tailpipe use | About 75% |
The University of Michigan estimates current small SUV life-cycle GHG at 429 g CO2e/mi for ICE, 312 for PHEV, 258 for HEV, and 267 for a 200-mile-range BEV.
That ranking reinforces the same basic pattern: electrification substantially lowers emissions, even within the SUV class.
By 2050, DOE GREET projects 2024 ICE SUV life-cycle emissions falling 28% to 318 gCO2e/mi, while electric SUV life-cycle emissions fall 66% to 73 gCO2e/mi.
In other words, the long-term emissions advantage of electric SUVs is expected to widen.
SUV emissions regulations and future CO2 targets
Policy is moving faster than today’s truck SUV averages.
The EPA light-truck CO2 compliance target was 234 g/mi in model year 2023, falling to 222 g/mi in 2024, 207 g/mi in 2025, and 187 g/mi in 2026.
That creates a clear benchmark gap against current truck SUV emissions.
Model year 2023 truck SUVs averaged 356 g/mi, far above the 234 g/mi light-truck target for the same year.
| Light-truck CO2 target | Target |
|---|---|
| Model year 2023 | 234 g/mi |
| Model year 2024 | 222 g/mi |
| Model year 2025 | 207 g/mi |
| Model year 2026 | 187 g/mi |
| Projected model year 2032 | 90 g/mi |
The projected light-truck CO2 target for 2032 is 90 g/mi, a 51% reduction from the 2026 target.
The projected combined light-duty fleet target is 85 g/mi in 2032.
The EPA’s multi-pollutant rule projects 7.2 billion metric tons of CO2e reductions from 2027 through 2055, plus annualized reductions by 2055 of 8,700 U.S. tons of PM2.5, 36,000 U.S. tons of NOx, and 150,000 U.S. tons of VOCs.
On criteria pollutants, the Tier 4 fleet-average NMOG+NOx standard reaches 15 mg/mi by 2032, a 50% cut from 30 mg/mi, while the Tier 4 particulate matter standard is 0.5 mg/mi for light-duty vehicles from model year 2030.
Notable SUV manufacturer and market-shift statistics
The industry-level numbers show how product mix can overpower efficiency gains.
- Honda’s average CO2 rose 18 g/mi over five years through 2023, due partly to shifting production toward truck SUVs.
- Mazda’s average CO2 rose 12 g/mi as truck SUV share jumped from 36% to 89%.
- Stellantis’ model year 2023 truck SUV fleet averaged 382 g/mi CO2.
- Ford’s model year 2023 truck SUV fleet averaged 401 g/mi CO2.
- Tesla’s model year 2023 car SUV fleet averaged 0 g/mi tailpipe CO2 with 117.1 mpg equivalent.
These figures underline a key ranking point inside SUV emissions statistics: not all SUVs perform alike.
Electrified car SUVs can post dramatically lower emissions, while large truck SUVs remain much heavier emitters.
Even the baseline physics supports that divide.
In model year 2024, ICE SUVs averaged 26 mpg in EPA OMEGA baseline data, compared with 35 mpg for ICE sedans.
The average ICE SUV curb weight was 1,797 kg, while BEV SUVs averaged 2,336 kg and carried an average 98 kWh battery for a 300-mile range.
BEV SUV electricity consumption averaged 0.31 kWh/mi.
- 26 mpg average fuel economy for model year 2024 ICE SUVs.
- 35 mpg average fuel economy for model year 2024 ICE sedans.
- 1,797 kg average curb weight for model year 2024 ICE SUVs.
- 2,336 kg average curb weight for model year 2024 BEV SUVs.
- 98 kWh average battery size for a 300-mile BEV SUV.
The quotable insight tying the entire dataset together is this: SUV technology is improving, but SUV popularity is improving faster.
That is why the category can deliver lower per-vehicle emissions in some segments while still driving higher total emissions globally.