Table of Contents
- SUV sales statistics: the headline story
- Table of contents
- U.S. SUV market share statistics show clear dominance
- U.S. SUV sales trends reveal a long-term structural shift
- U.S. SUV brand and segment statistics highlight where demand is concentrated
- Best-selling SUV sales statistics in the U.S.
- SUV pricing and EV crossover statistics add another layer to growth
- Global SUV sales statistics show the segment has become a worldwide force
- Europe, China, and India SUV market data underline global demand
- SUV industry revenue and market benchmark statistics
SUV sales statistics: the headline story
SUVs are no longer just a popular segment—they are the center of the auto market.
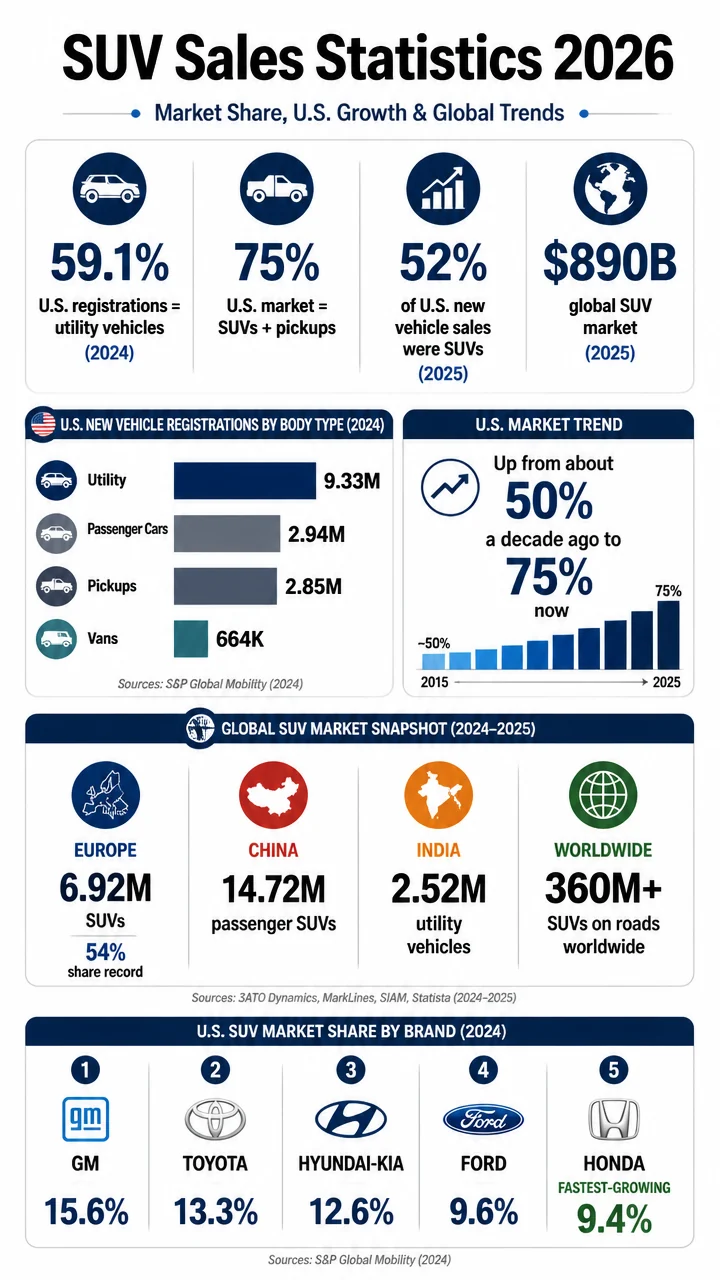
In the U.S., utility vehicles took 59.10% of new registrations in 2024, while SUVs and pickups together hit a record 75% of light-vehicle registrations.
That dominance is not limited to America.
Europe set a new SUV share record at 54% in 2024, China sold 14.72 million passenger SUVs, and more than 360 million SUVs were already on roads worldwide in 2023.
- 9,328,637 U.S. utility vehicle registrations in 2024
- 59.10% of all U.S. new vehicle registrations were utility vehicles in 2024
- 52% of U.S. new vehicle sales were SUVs in 2025
- 6.92 million SUVs registered in Europe in 2024
- 14,722,084 passenger SUVs sold in China in 2024
- 2,520,691 utility vehicles sold in India in FY2024
- USD 890 billion global SUV market revenue in 2025
Table of contents
- U.S.
SUV market share statistics
- U.S.
SUV sales trends over time
- U.S.
SUV brand and segment statistics
- Best-selling SUVs in the U.S.
- SUV pricing and EV crossover data
- Global SUV sales statistics
- Europe, China, and India SUV market data
- SUV industry revenue and market benchmarks
U.S. utility vehicle registrations reached 9,328,637 units in 2024, according to Alliance for Automotive Innovation data.
That gave utility vehicles 59.10% of all new light-vehicle registrations.
By comparison, passenger car registrations fell to 2,944,852 units in 2024, equal to just 18.66% of the market.
Pickup truck registrations totaled 2,846,236 units, or 18.03%, while vans and minivans accounted for 664,191 units and 4.21% share.
The U.S. market is no longer split across many body styles in a balanced way.
Utility vehicles alone now command nearly three out of every five new registrations, while traditional passenger cars have been pushed below one in five.
| U.S. vehicle type | 2024 registrations | Market share |
|---|---|---|
| Utility vehicles | 9,328,637 | 59.10% |
| Passenger cars | 2,944,852 | 18.66% |
| Pickup trucks | 2,846,236 | 18.03% |
| Vans and minivans | 664,191 | 4.21% |
Using a slightly different source lens, JATO Dynamics reported that SUVs and pickup trucks combined reached 9.17 million units in 2024, up 5% year over year, and together represented a record 75% of U.S. light-vehicle registrations.
A decade earlier, SUVs and pickups represented only about half of the U.S. new-vehicle market.
That means the market has shifted from a broad mix of sedans, coupes, vans, trucks, and SUVs to one dominated by taller utility-oriented vehicles.
- 59.10% U.S. utility vehicle share in 2024 is the clearest sign of SUV-led demand.
- 75% combined SUV and pickup share shows trucks and utility vehicles have become the mainstream choice.
- 18.66% passenger car share highlights how sharply sedans have declined.
- Vans and minivans remain a niche at 4.21%.
U.S. SUV sales trends reveal a long-term structural shift
SUV market share in the U.S. rose from 20% in 2000 to 55% in 2022, according to Inovev.
The path upward was steady: 30% in 2011, 40% in 2016, and 50% in 2020.
GCBC data pushes the story further.
SUVs accounted for 38% of U.S. new vehicle sales in 2016, 46% in 2021, and 52% in 2025.
That means SUVs alone now make up more than half of U.S. new-vehicle demand.
Volume growth has been just as dramatic.
U.S.
SUV sales rose from about 4 million units annually in the early 2000s to 8 million in 2018, effectively doubling over that span.
Big number: In 2025, roughly four SUVs were sold in the U.S. for every sedan.
The market imbalance was already clear before the latest records.
In 2019, U.S.
SUV sales totaled 8,176,527 units versus 4,566,654 passenger cars, meaning SUVs outsold cars by more than 3.6 million units.
S&P Global Mobility also highlighted the split through seasonally adjusted annualized rates: in December 2023, U.S. light-truck SAAR was 12.2 million units compared with just 3.0 million for passenger cars.
- 20% U.S.
SUV share in 2000
- 40% in 2016
- 50% in 2020
- 52% of U.S. new vehicle sales in 2025
- 4:1 SUV-to-sedan sales ratio in 2025
U.S. SUV brand and segment statistics highlight where demand is concentrated
General Motors led the U.S.
SUV market in 2024 with a 15.6% share.
Toyota followed at 13.3%, Hyundai-Kia at 12.6%, and Ford at 9.6%.
Honda held 9.4% and was the fastest-growing SUV brand among the leaders.
| Brand group | U.S. SUV market share, 2024 |
|---|---|
| General Motors | 15.6% |
| Toyota | 13.3% |
| Hyundai-Kia | 12.6% |
| Ford | 9.6% |
| Honda | 9.4% |
Segment data shows where the biggest pools of volume sit.
Compact non-premium SUVs were the top-selling U.S. segment in 2024 with a 21.1% market share, up 1.3 percentage points versus 2023, which had itself been a prior record.
That segment kept expanding in 2025, reaching 21.2% share—an all-time high.
Meanwhile, midsize non-premium SUVs held 14.9% of the U.S. market in December 2024.
At the larger end, full-size SUVs reached 3.5% market share in 2025, nearly double their 2013 level.
That suggests growth is not only coming from affordable compact crossovers; buyers are also supporting larger, higher-priced SUV formats.
Large pickups still matter, but the numbers underline a subtle shift.
Their annual U.S. share was 13.6% in 2024, the lowest since 2017, even though they reached 14.7% share in December 2024, their best month of that kind since December 2022.
- Compact non-premium SUVs are the biggest single segment in America.
- GM leads overall U.S.
SUV share, but competition among the top five is tight.
- Honda was the fastest-growing major SUV brand in 2024.
- Full-size SUVs are gaining share despite higher prices.
Best-selling SUV sales statistics in the U.S.
The Toyota RAV4 was the best-selling SUV in the U.S. in 2024 with 475,193 units sold.
JATO Dynamics also noted that when the Ford F-Series is split by model, the RAV4 was the best-selling new vehicle in the country overall.
The Honda CR-V followed with 402,791 units, while the Tesla Model Y sold an estimated 372,613 units.
That gave the Model Y an unusual dual role as both a leading EV and one of the country’s top-selling SUVs.
| Model | U.S. sales, 2024 | Notes |
|---|---|---|
| Toyota RAV4 | 475,193 | Best-selling SUV; best-selling vehicle when F-Series is split |
| Honda CR-V | 402,791 | Top compact SUV contender |
| Tesla Model Y | 372,613 | 28.6% of U.S. EV sales |
| Nissan Rogue | 245,724 | Trailing CR-V by nearly 75,000 units |
| Jeep Grand Cherokee | 216,148 | Strong midsize/2-row and 3-row presence |
| Chevrolet Equinox | 207,730 | Big jump followed in 2025 |
| Hyundai Tucson | 206,126 | Competitive compact SUV volume |
| Chevrolet Trax | 200,689 | Fast-rising value crossover |
| Ford Explorer | 194,094 | Led the midsize SUV segment |
| Subaru Crosstrek | 181,811 | Top subcompact-style crossover player |
| Subaru Forester | 175,521 | Stable compact SUV demand |
Within the compact SUV class, the Honda CR-V outsold the Nissan Rogue by nearly 75,000 units in 2024.
That is a meaningful gap in one of the largest and most fiercely contested segments in the market.
The Ford Explorer led the U.S. midsize SUV segment in 2024 with 194,094 deliveries, up 3.9% year over year.
In pickups, the Toyota Tacoma posted 192,813 units, underscoring how closely some truck nameplates now compete with mainstream SUVs for family-vehicle buyers.
475,193 RAV4 sales made Toyota’s compact SUV the clearest symbol of America’s shift toward utility vehicles.
Early 2025 tracking showed the same patterns continuing.
The Toyota RAV4 reached 479,288 U.S. sales in 2025, while GCBC reported 437,260 units through November 2025 year-to-date.
The Chevrolet Equinox surged to 332,301 U.S. units in 2025, up 40.5%, and stood at 273,270 through November 2025, up 47.97%.
SUV pricing and EV crossover statistics add another layer to growth
The average transaction price for SUVs in the U.S. reached $43,000 in 2025.
That makes the category’s scale even more significant: SUVs are not just driving unit sales, they are also pulling a large amount of consumer spending into one body style.
Luxury demand is adding to the value story.
U.S. luxury SUVs rose 18% across size categories in 2025 as buyers shifted away from luxury sedans.
EV data also increasingly overlaps with SUV sales statistics.
U.S. electric vehicle sales totaled 1.3 million units in 2024, equal to 8.1% of new-vehicle sales.
The Tesla Model Y alone delivered 372,613 units, or 28.6% of all U.S.
EV sales.
Tesla Model Y and Model 3 combined accounted for over 40% of U.S.
EV sales in 2024, but the Model Y’s relevance here is especially important because it is both an EV leader and a mainstream SUV volume leader.
$43,000 was the average U.S.
SUV transaction price in 2025.
Global SUV sales statistics show the segment has become a worldwide force
Global light-vehicle sales reached 88.2 million units in 2024, up 1.7%, and S&P Global Mobility forecast 89.6 million for 2025.
Within that huge market, SUVs continue to take a rising share of both volume and revenue.
The International Energy Agency reported that SUVs accounted for 48% of global car sales in 2023.
In advanced economies, SUV sales reached about 20 million units in 2023, exceeding 50% market share for the first time.
There were already more than 360 million SUVs on roads worldwide in 2023, meaning more than one in four cars globally was an SUV.
The IEA also said about 30 million internal-combustion SUVs were added to the global fleet in 2023.
Even electrification has not reduced the format’s grip.
More than 55% of new electric car registrations globally were SUVs in 2023.
- 48% of global car sales were SUVs in 2023
- 360+ million SUVs were on roads worldwide in 2023
- 55%+ of global EV registrations were SUVs
- 43.9% of worldwide automotive market revenue came from SUVs in 2023
On the model side, SUVs dominate global best-seller rankings too.
The Toyota RAV4/Wildlander sold 1,187,000 units globally in 2024, making it the world’s best-selling light vehicle.
The Tesla Model Y was just behind at 1,185,000 units, a gap of only 2,000 units.
Other global SUV leaders included the Toyota Corolla Cross/Frontlander at 859,000 units, up 18%, and the Honda CR-V/Breeze at 854,000 units, up 1%.
| Global SUV model | 2024 sales | Trend |
|---|---|---|
| Toyota RAV4/Wildlander | 1,187,000 | World best-selling light vehicle |
| Tesla Model Y | 1,185,000 | Only 2,000 units behind RAV4 |
| Toyota Corolla Cross/Frontlander | 859,000 | Up 18% |
| Honda CR-V/Breeze | 854,000 | Up 1% |
Europe, China, and India SUV market data underline global demand
Europe registered 6.92 million SUVs in 2024, up 4% from 2023.
SUVs accounted for a record 54% of European new car registrations across Europe-28 markets.
Compact SUVs, or C-SUVs, represented 42% of European SUV registrations in 2024, while small SUVs, or B-SUVs, accounted for 36%.
Luxury SUVs also gained momentum, rising 13% to 56,300 units.
By group, Volkswagen Group accounted for nearly one quarter of all new SUVs registered in Europe in 2024.
Stellantis sold almost 800,000 SUVs, down 7%, while Hyundai-Kia sold 705,500, down 1%.
China remains the world’s biggest SUV arena by volume. The country sold 14,722,084 passenger SUVs in 2024, and CAAM preliminary data put 2025 at 16,123,377 units.
SUVs represented 46.8% of China passenger vehicle sales in 2024.
China’s SUV wholesale volume of 14.72 million units rose 11.5% year over year, while retail SUV sales reached 11.31 million, up 9.7%.
The Tesla Model Y led China retail SUV sales with 480,309 units, and posted 556,689 wholesale sales.
The BYD Yuan PLUS added 275,223 retail units in China in 2024.
Meanwhile, the top 10 Chinese SUV producers sold 9.642 million units, accounting for 65.5% of total SUV sales.
India is also becoming increasingly SUV-heavy. Utility vehicles sold 2,520,691 units in FY2024, up 26% year over year, and represented 59.74% of passenger vehicle sales.
SUVs alone accounted for an estimated 2.11 million FY2024 wholesale units.
Maruti Suzuki sold 642,296 utility vehicles in India in FY2024 for a 25% UV market share, while the Tata Nexon was India’s best-selling UV with 171,697 units.
In calendar year 2024, India sold 2.749 million utility vehicles, and the top 25 UV models made up 91% of total UV sales.
| Market | Key 2024 SUV/UV volume | Share statistic |
|---|---|---|
| United States | 9,328,637 utility vehicle registrations | 59.10% of new registrations |
| Europe | 6.92 million SUVs | 54% of new car registrations |
| China | 14,722,084 passenger SUVs | 46.8% of passenger vehicle sales |
| India | 2,520,691 utility vehicles (FY2024) | 59.74% of passenger vehicle sales |
SUV industry revenue and market benchmark statistics
The global SUV market was valued at USD 890 billion in 2025, reflecting the category’s enormous weight in the broader automotive economy.
Statista estimated that SUVs represented 43.9% of worldwide automotive market revenue in 2023.
In North America, the concentration was even stronger: the United States generated a 54% SUV revenue share and Canada 55%.
At the manufacturer level, Toyota led global SUV revenue with $78.4 billion in 2023, followed by Honda at $64.4 billion.
Product mix benchmarks help explain why revenue is so concentrated.
Compact SUVs held 42.98% of global SUV market share in 2024, while petrol SUVs accounted for 59.36% of global SUV sales.
Regionally, Asia-Pacific commanded 38.89% of the global SUV market in 2024.
- USD 890 billion makes SUVs one of the most valuable vehicle categories in the world.
- Compact SUVs are the dominant global format by share.
- Petrol SUVs still lead globally, even as EV SUVs gain ground.
- Asia-Pacific is the largest regional SUV market by share.
Across the supplied statistics, the pattern is consistent: SUVs have moved from a popular option to the default shape of the modern car market.
They lead U.S. registrations, dominate Europe’s new-car mix, command massive scale in China and India, and now account for a huge portion of global automotive revenue.