Table of Contents
- SUV industry statistics show a market that is no longer just growing—it is reshaping the global auto business.
- SUV industry market size and growth statistics
- SUV sales and usage statistics worldwide
- SUV industry segment statistics by size, fuel, drivetrain, and seating
- Regional SUV industry statistics
- U.S. SUV industry statistics
- China SUV industry statistics
- Electric SUV statistics and EV mix trends
- SUV emissions and environmental statistics
- SUV industry statistics by country and market benchmark
- SUV industry fast facts for marketers, analysts, and publishers
SUV industry statistics show a market that is no longer just growing—it is reshaping the global auto business.
From 41 million global SUV units sold in 2024 to forecasts topping USD 1.23 trillion by 2030, the category now dominates sales mix, regional demand, and even electric adoption trends.
Table of contents
- Key takeaways
- SUV industry market size and growth statistics
- SUV sales and usage statistics worldwide
- SUV industry segment statistics by size, fuel, drivetrain, and seating
- Regional SUV industry statistics
- U.S.
SUV industry statistics
- China SUV industry statistics
- Electric SUV statistics and EV mix trends
- SUV emissions and environmental statistics
Key takeaways
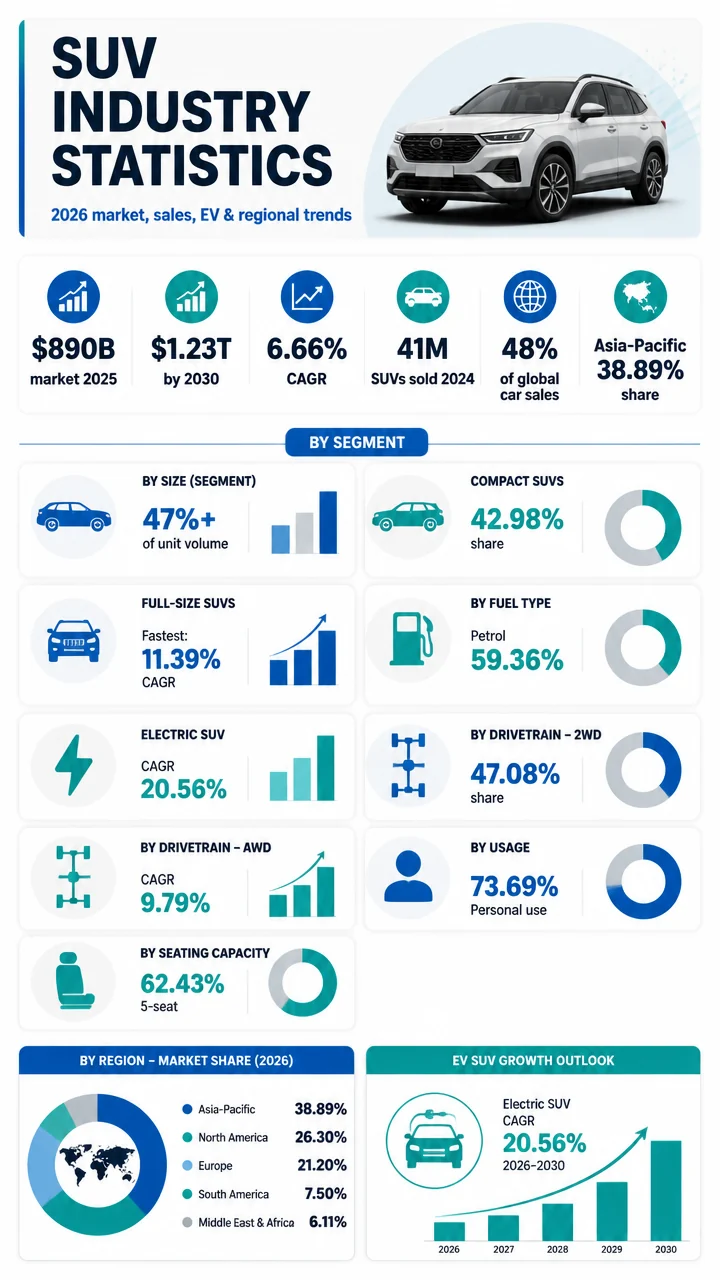
- USD 890 billion: estimated global SUV market value in 2025, according to Mordor Intelligence.
- USD 1.23 trillion by 2030: Mordor Intelligence forecast for the global SUV market, implying a 6.66% CAGR.
- 41 million units: global SUV sales in 2024.
- 48% share: SUVs accounted for nearly half of global large-vehicle sales in 2024 and also hit 48% of global car sales in 2023.
- Asia-Pacific leads: the region held 38.89% of global SUV market share in 2024 and contributed over 47% of global SUV unit volume.
- Compact SUVs dominate today: 42.98% market share in 2024.
- Full-size SUVs are growing fastest: projected 11.39% CAGR through 2030.
- Petrol still leads: petrol-powered SUVs represented 59.36% of global market size in 2024.
- Electric SUVs are rising fast: forecast to grow at a 20.56% CAGR through 2030.
- Personal-use demand rules: 73.69% of global SUV deliveries in 2024 were for personal use.
SUV industry market size and growth statistics
The global SUV market is already operating at enormous scale. Mordor Intelligence valued the market at USD 890 billion in 2025, while The Business Research Company estimated USD 890.07 billion in 2025.
That close alignment reinforces the core takeaway: SUVs are now a near-trillion-dollar industry.
Big number
USD 1.23 trillion is the projected size of the global SUV market by 2030, based on Mordor Intelligence data.
Multiple forecasts point to sustained expansion, even if they use different methodologies and market definitions.
| Source | Base year value | Forecast value | Forecast year | CAGR |
|---|---|---|---|---|
| Mordor Intelligence | USD 890 billion (2025) | USD 1.23 trillion | 2030 | 6.66% |
| The Business Research Company | USD 890.07 billion (2025) | USD 1,182.5 billion | 2030 | 5.8% |
| SNS Insider | USD 873.98 billion (2023) | USD 1,549.42 billion | 2032 | 6.60% |
| Polaris Market Research | USD 871.59 billion (2025) | USD 1,523.67 billion | 2034 | 6.4% |
| Fortune Business Insights | USD 1,310.32 billion (2025) | USD 3,172.53 billion | 2034 | 10.62% |
The short-term growth picture is also strong. The Business Research Company expects the market to climb from USD 890.07 billion in 2025 to USD 941.99 billion in 2026, while Polaris projects USD 926.33 billion in 2026.
Fortune Business Insights is more bullish, placing the market at USD 1,415.16 billion in 2026.
Why it matters
Even with differing revenue estimates, every source in the dataset points in the same direction: the SUV industry is expanding steadily, and in some forecasts, aggressively.
SUV sales and usage statistics worldwide
Global SUV demand is no longer a niche trend—it is the mainstream market. Around 41 million SUV units were sold globally in 2024, up from 38.7 million units in 2023.
That sales volume translates into a stunning share of the broader auto market:
- 48% of all large-vehicle sales worldwide in 2024 came from SUVs.
- 47% of total light-vehicle sales in 2023 were SUVs.
- 48% of global car sales in 2023 were SUVs, a record share.
- About 50% of global car sales in 2023 came from SUVs and pick-up trucks combined.
Pull quote
More than one in four cars on the road worldwide are SUVs.
The installed base is just as notable as annual sales.
In 2023, more than 360 million SUVs were on roads worldwide.
That means SUVs are not simply winning new-buyer preference; they are becoming a defining part of the global vehicle fleet.
Advanced economies have crossed an important threshold. SUV sales reached around 20 million units in advanced economies in 2023, pushing the segment to more than 50% market share for the first time.
Fast facts
- 41 million global SUV sales in 2024
- 38.7 million global SUV sales in 2023
- 360+ million SUVs on roads worldwide in 2023
- 48% share of global car sales in 2023
SUV industry segment statistics by size, fuel, drivetrain, and seating
The biggest SUV story is not just growth, but mix. Buyers are concentrating around a few dominant configurations, while faster-growing subsegments are changing where the next gains may come from.
SUV size segment statistics
- Compact SUVs led the global SUV industry with 42.98% market share in 2024.
- Mid-size SUVs sold over 19 million units globally in 2024.
- Mid-sized SUVs are projected to dominate the global SUV industry with a 41.60% share in 2026.
- Full-size SUVs are the fastest-growing size segment, with an expected 11.39% CAGR through 2030.
- Global full-size SUV sales rose 12% to 4.1 million units in 2023.
The takeaway: compact and mid-size SUVs drive the bulk of volume today, but full-size SUVs are gaining momentum faster than any other size class.
SUV fuel type statistics
- Petrol-powered SUVs accounted for 59.36% of global SUV market size in 2024.
- Petrol SUVs represented over 43% of global SUV sales in 2024.
- ICE SUVs are projected to hold 58.45% of the global SUV market in 2026.
- Electric SUVs are projected to grow at a 20.56% CAGR through 2030.
Internal combustion still dominates today’s revenue mix, but electric SUV growth rates are dramatically higher than the broader market average.
Drivetrain and use-case statistics
- Two-wheel-drive SUVs captured 47.08% of global SUV market share in 2024.
- All-wheel-drive SUV demand is advancing at 9.79% CAGR through 2030.
- Front-wheel-drive SUVs are projected to hold 48.56% of the global market in 2026.
- Personal-use SUVs comprised 73.69% of global deliveries in 2024.
- Commercial SUV uptake is expanding at 7.89% CAGR during 2025–2030.
These figures show a classic pattern: mainstream consumer configurations dominate the present, while more specialized drivetrains and commercial applications represent a meaningful growth layer.
Seating layout statistics
- Five-seater SUV layouts held 62.43% of global market share in 2024.
- Five-seater SUVs are projected to hold 60.69% of global market share in 2026.
- Seven-seater SUVs are forecast to post a 6.79% CAGR through 2030.
At a glance
- Most popular size in 2024: Compact SUVs, 42.98%
- Fastest-growing size: Full-size SUVs, 11.39% CAGR
- Leading fuel in 2024: Petrol, 59.36%
- Fastest-growing powertrain trend: Electric SUVs, 20.56% CAGR
- Leading use case: Personal use, 73.69%
- Most common seating: Five-seater, 62.43%
Regional SUV industry statistics
Asia-Pacific is the center of gravity for the SUV industry. The region commanded 38.89% of the global SUV market in 2024 and is expected to expand at an 8.19% CAGR through 2030, according to Mordor Intelligence.
Other sources reinforce that dominance from different angles:
- 35% global share in 2023, according to SNS Insider.
- Over 47% of global SUV unit volume in 2024, according to Market Reports World.
- 63.20% market share in 2025, according to Fortune Business Insights.
- USD 828.14 billion in SUV market revenue from Asia Pacific in 2025, according to Fortune Business Insights.
| Region | Statistic | Year | Source |
|---|---|---|---|
| Asia-Pacific | 38.89% global SUV market share | 2024 | Mordor Intelligence |
| Asia-Pacific | Over 47% of global SUV unit volume | 2024 | Market Reports World |
| Asia Pacific | 63.20% market share; USD 828.14 billion | 2025 | Fortune Business Insights |
| Europe | USD 311.36 billion; 23.76% of global revenue | 2025 | Fortune Business Insights |
| North America | USD 113.78 billion; 8.68% share | 2025 | Fortune Business Insights |
Europe remains a large revenue market, but Asia-Pacific is the growth engine. Europe reached USD 311.36 billion in 2025, equal to 23.76% of total global SUV industry revenue.
North America held 8.68% of global SUV market value with a USD 113.78 billion valuation in 2025.
Why it matters
If you want to understand where SUV volume, future growth, and regional scale are concentrated, the answer is overwhelmingly Asia-Pacific.
U.S. SUV industry statistics
The U.S. market shows how fully SUVs have overtaken traditional passenger cars. Utility vehicles accounted for 59.10% of U.S. new vehicle sales in 2024, totaling 9,328,637 units.
Several U.S. data points tell the same story in slightly different ways:
- Total U.S. new vehicle sales reached 15.79 million in 2024.
- SUVs and trucks made up 75% of total U.S. car sales in 2024.
- SUV and pickup sales hit 9.17 million units in 2024, up 5% year over year.
- SUVs captured 58% of all U.S. vehicle transactions from January through October 2024, a record high.
- Utility vehicles represented 39.20% of total U.S. vehicles in operation at the end of 2024, or 113,384,621 units.
Big number
USD 46,211 was the average U.S.
SUV transaction price in 2024, up 44% over two decades.
Production data is just as SUV-heavy. EPA data shows 14,799,239 vehicles were produced in the U.S. in model year 2024, and car SUVs plus truck SUVs accounted for 60% of all new U.S. vehicles produced.
- Truck SUVs alone reached almost 50% of all new U.S. vehicle production in model year 2024.
- Under NHTSA regulations, trucks including SUV trucks accounted for 66% of all new U.S. vehicles in model year 2024.
- Sedan/wagons held less than 25% of U.S. new-vehicle production share.
- U.S. truck SUV average fuel economy reached 25.7 mpg, a record high.
- 30% of U.S. car SUVs produced in model year 2024 were battery electric vehicles.
- 77% of U.S.
SUVs under 4,000 pounds inertia weight
met the regulatory truck definition, the highest since at least 2000.
Brand competition is still intense inside the segment. General Motors led the U.S.
SUV segment with a 15.6% market share in 2024.
For market sizing, Fortune Business Insights projects the U.S.
SUV market to reach USD 104.33 billion by 2026.
China SUV industry statistics
China is arguably the single most important country market for SUVs by unit scale. The China SUV market is projected to reach USD 391.86 billion by 2026, and the volume data is just as striking.
- More than 11 million SUV registrations were recorded in China in 2024.
- SUV retail sales reached 11.311 million units in 2024, up 9.7% year over year.
- Cumulative SUV production reached 13.582 million units in 2024, up 10.3% year over year.
- December 2024 SUV production hit 1.54 million units, up 24.6% year over year.
- SUVs accounted for 49.41% of China’s narrow passenger-vehicle retail sales in 2024.
| China SUV market metric | 2024 figure |
|---|---|
| SUV retail sales | 11.311 million units |
| SUV production | 13.582 million units |
| Share of narrow passenger-vehicle retail sales | 49.41% |
| Top 10 manufacturers’ sales | 9.642 million units |
| Top 10 manufacturers’ market share | 65.5% |
| Chinese-brand SUV share | 69.5% |
Concentration is high. China’s top 10 SUV manufacturers sold 9.642 million units in 2024, accounting for 65.5% of total SUV sales.
Domestic brands are especially strong. Chinese-brand SUVs held a 69.5% share of domestic SUV sales in 2024.
There is also impressive model-level depth:
- Tesla Model Y sold 480,309 units in China in 2024, ranking first among all SUVs.
- 34 SUV models posted cumulative sales above 100,000 units in 2024.
These figures suggest China is not just large—it is broad, competitive, and capable of sustaining multiple high-volume nameplates.
Electric SUV statistics and EV mix trends
Electric SUVs are becoming one of the most important growth stories in the auto market. Mordor Intelligence projects electric SUVs to expand at a 20.56% CAGR through 2030, far faster than overall SUV market growth.
Registration and sales-mix data show that EV adoption is already tilting heavily toward SUV body styles:
- More than 55% of new electric car registrations were SUVs in 2023.
- Only 5% of SUVs on the road were electric in 2023.
- Europe sold a record 1.3 million electric SUV units in 2024.
- Electric SUVs accounted for 66% of BEV sales in Europe in 2025, up 12 percentage points from 2022.
- Electric SUVs accounted for 75% of U.S.
BEV sales
in 2025. - That 75% EV-SUV share in the U.S. exceeded the 62% SUV share of all U.S. light-duty vehicle sales.
Pull quote
Electric SUVs made up 75% of U.S.
BEV sales in 2025.
This creates a notable split in the data.
On one hand, electric SUVs are taking the lead within EV adoption.
On the other, the global SUV parc remains overwhelmingly combustion-powered, since just 5% of SUVs on the road were electric in 2023.
In plain terms: electric SUVs are winning the future purchase decision faster than they are reshaping the existing global fleet.
SUV emissions and environmental statistics
SUV growth has a major emissions footprint. According to the IEA, combustion-related CO2 emissions from the global SUV fleet totaled about 1 billion tonnes in 2023.
- SUV-related CO2 emissions increased by around 100 million tonnes in 2023.
- SUV emissions growth accounted for more than 20% of the increase in global energy-related CO2 emissions in 2023.
Why it matters
The same vehicle class driving sales growth, production share, and consumer preference is also exerting outsized influence on global transport emissions.
That tension helps explain why electric SUV growth matters so much.
The category is now too large to treat as a side segment: with 48% of global car sales, 360+ million vehicles on roads, and roughly 1 billion tonnes of combustion-related CO2 tied to the fleet, SUVs are central to both the business and policy future of mobility.
SUV industry statistics by country and market benchmark
A few national benchmarks stand out immediately from the dataset.
- China: projected SUV market value of USD 391.86 billion by 2026; 11.311 million retail sales in 2024.
- India: projected SUV market value of USD 132.14 billion by 2026; SUV sales surpassed 2 million units for the first time in 2024.
- United States: projected SUV market value of USD 104.33 billion by 2026; utility vehicles accounted for 59.10% of new vehicle sales in 2024.
- Europe: sold a record 1.3 million electric SUV units in 2024; SUVs and MPVs represented 61% of total light-duty vehicle sales in 2025.
- U.S. and Canada combined: SUVs represented 38% of all light-vehicle sales in 2024.
India’s milestone is particularly notable because it signals how far the SUV format has penetrated emerging demand markets.
Crossing 2 million annual SUV sales in 2024 places India among the world’s key growth stories for the segment.
SUV industry fast facts for marketers, analysts, and publishers
Fast facts
- 41 million SUVs sold globally in 2024
- USD 890 billion global market value in 2025
- USD 1.23 trillion projected market value by 2030
- 42.98% share for compact SUVs in 2024
- 11.39% CAGR for full-size SUVs through 2030
- 59.36% share for petrol SUVs in 2024
- 20.56% CAGR for electric SUVs through 2030
- 73.69% of deliveries for personal use in 2024
- 62.43% share for five-seater SUVs in 2024
- 38.89% Asia-Pacific market share in 2024
- 9,328,637 utility vehicles sold in the U.S. in 2024
- 11.311 million SUV retail sales in China in 2024